Research Method and Key Findings
We compared hospital networks for health plans sold on the Affordable Care Act’s (ACA’s) health insurance exchanges (HIEs) with hospital networks for comparable[1] plans sold outside of the exchanges. In the geographies we analyzed[2], ‘on-HIE’ and ‘off-HIE’ hospital networks were the same for health plans offered by HUM, and for health plans offered by the major non-profit insurers. In contrast, on-HIE hospital networks for health plans offered by AET, CI, and WLP were substantially more narrow than hospital networks for off-HIE health plans sold by these same issuers[3] (Exhibit 1)
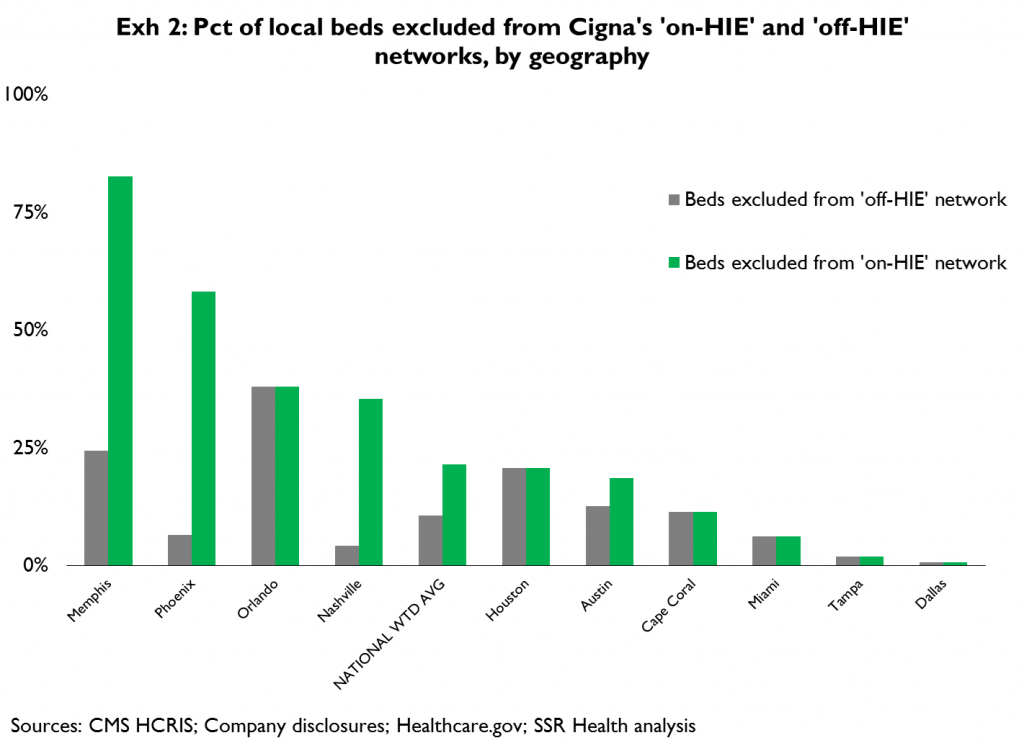
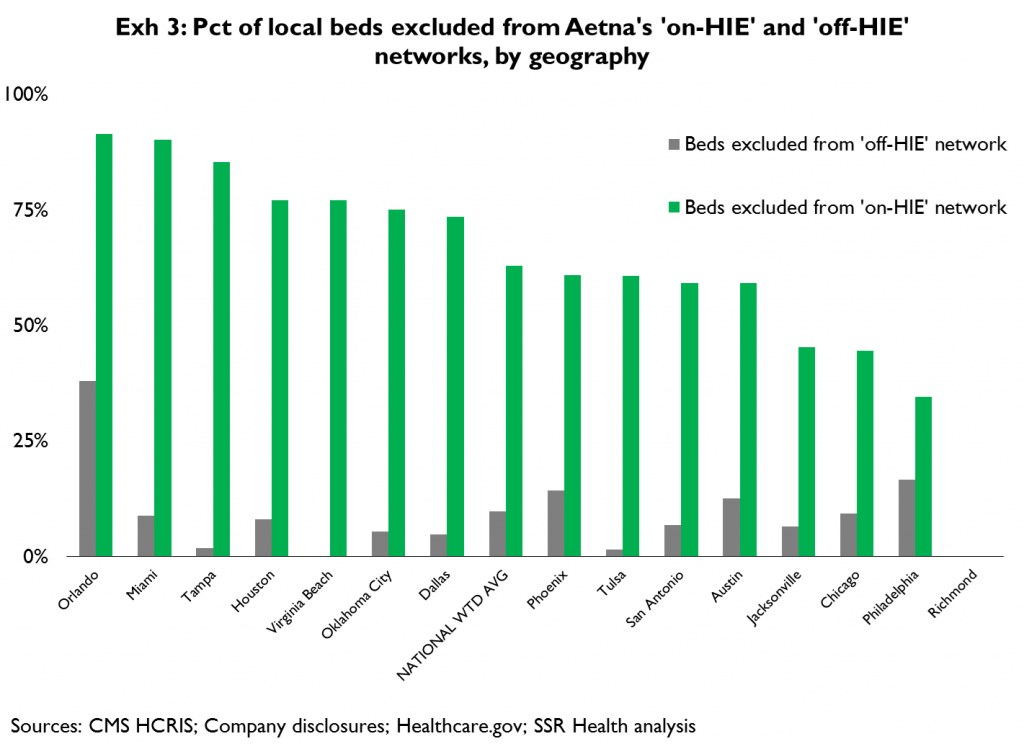
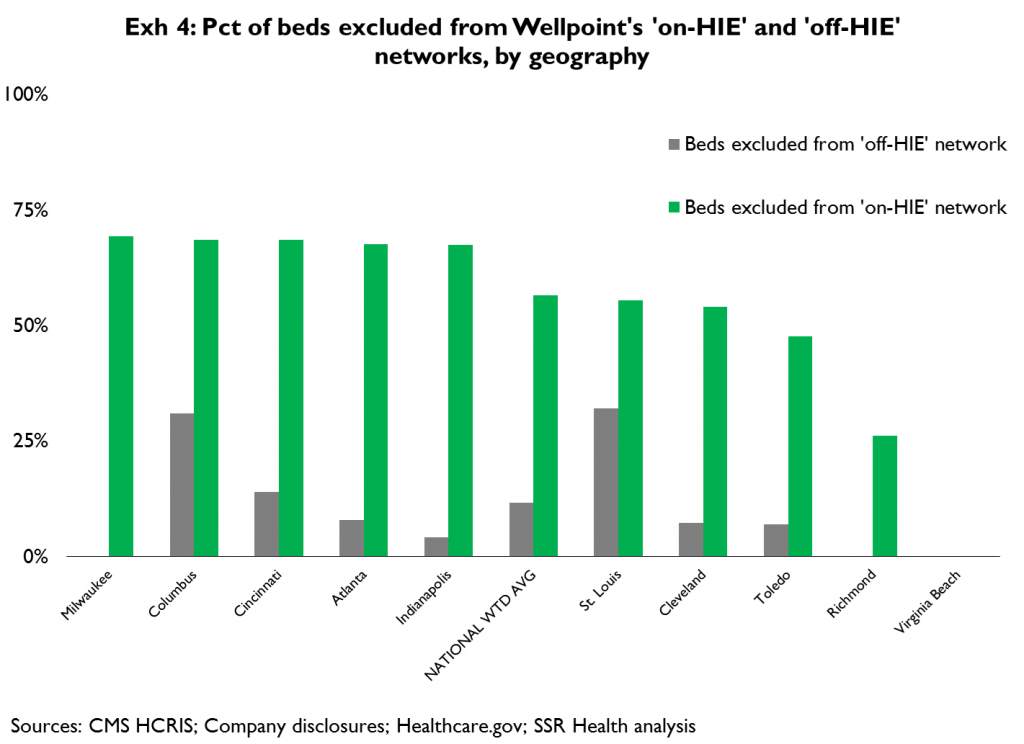
Exhibits 2 thru 4 compare the generally limited percent of local[4] hospital beds that are excluded from each issuer’s ‘off-HIE’ health plans (gray bars) with the often large percent of local beds that are excluded from each issuer’s ‘on-HIE’ health plans (green bars). MSA[5]s in which each issuer is active (on the HIEs) are provided on the x-axis, as is a weighted national average of beds excluded from off-HIE and on-HIE networks
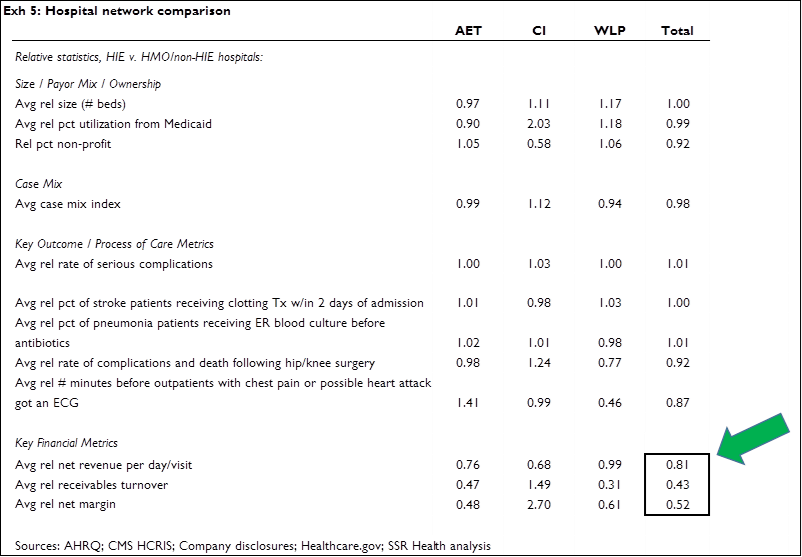
We compared on- and off-HIE hospitals on the basis of various key metrics (Exhibit 5) in an attempt to establish whether, and if so how, these hospitals differ. We found that on average, on- and off-HIE hospitals are generally the same bed size, have similar percentages of Medicaid utilization, and are similarly likely to be non-profit. We also found that on- and off-HIE networks have similar average case mix, and comparable scores on select outcome and process-of-care metrics – if anything, on-HIE hospitals’ scores were actually better. The major difference – and as far as we can tell the only major difference – is that ‘on-HIE’ hospitals tend to get paid less (lower average net revenue per visit, which cannot be accounted for by either case mix or payor mix), have a harder time collecting what they are paid (lower receivables turnover); and, are less profitable (lower average net margin)
Investment Relevance
As a general matter, the tendency of some HIE issuers to offer very narrow hospital networks adds to mounting evidence[6] that potential HIE beneficiaries may not see the HIE plan offerings as value for money, and that enrollment will therefore (continue to) be very weak. This further underscores our belief that adverse selection is highly likely, and that this will force significant changes to policy[7] in the relatively near term
More specific to hospitals – it’s clear that a substantial percentage of HIE enrollees are simply former individual coverage beneficiaries that are now buying on the exchanges, as opposed to persons who were previously un-insured. Because HIE plans carry higher deductibles and higher co-payments than were typical of individual coverage plans sold before 2014, hospitals must now collect a higher percentage of their billings directly from persons with individual coverage, rather than from these persons’ insurers. And, based on the findings in this research note (‘on-HIE’ hospitals tend to be less financially stable) it appears this added burden may be falling disproportionately on hospitals that are least able to afford it. This implies a need for the average ‘on-HIE’ hospital to rather dramatically raise its game with respect to revenue cycle management (RCM), which in turn implies growing demand for providers of these services
The field of hospital-oriented RCM providers is broad and diverse; RCM services can be offered as an integrated component of a service provider’s core offerings (e.g. CERN, CPSI, MDRX and QSII in IT, BAC and PNC in lending), or as a stand-alone consulting service (e.g. Deloitte, ACN, ABCO). And, the relevance of RCM to overall revenues and profits ranges considerably, from RCM-centered businesses (e.g. STRM, AH) to more diverse firms where RCM is an essential feature of product and service offerings, but a relatively small or even inconsequential direct driver of revenues and profits (e.g. GE, Siemens, MCK, MMM)
We believe expanded demand for hospital-oriented RCM services would most directly benefit the companies most levered to this service offering, specifically STRM and AH. Secondarily, companies offering RCM services as part of an integrated hospital operating system, and where the RCM component of the offering is a significant percentage of revenues (e.g. 21% for CPSI, 14% for QSII) also should benefit from growing hospital-oriented RCM demand. CPSI is of particular interest because of its focus on smaller hospitals (94% of customers have ≤100 beds, 99% have ≤200 beds). We note that ‘in-HIE’ and ‘off-HIE’ hospitals’ bed sizes are similar; however we believe the odds of a hospital having invested in state-of-the-art RCM are likely to fall with bed size, thus CPSI’s hospital market segment may offer greater opportunity for new installations
[1] Defined as most restrictive HMO offering per carrier widely available in large group segment
[2] Our analysis centered on the 26 metropolitan statistical areas (MSAs), within states with federally-facilitated HIEs, with the greatest numbers of potential HIE beneficiaries. Specifically, these are: Phoenix, Houston, San Antonio, Dallas, Austin, Miami, Tampa, Orlando, Jacksonville, Cape Coral, Atlanta, Chicago, Indianapolis, St. Louis, Cleveland, Cincinnati, Columbus, Toledo, Oklahoma City, Tulsa, Philadelphia, Memphis, Nashville, Virginia Beach, Richmond, and Milwaukee
[3] We considered that the difference between AET, CI, and WLP’s on- and off-HIE networks could be explained by the fact that their off-HIE networks are broader than those offered by the non-profits; i.e. that AET, CI, and WLP’s on-HIE networks are no more restrictive than the non-profits’ ‘typical’ networks. So we directly compared the ‘on-HIE’ networks of AET, CI, and WLP with the networks of the major non-profit plans, and found the ‘on-HIE’ networks of AET, CI, and WLP are in fact more narrow than the major non-profits’ networks
[4] Defined as falling within a 25-mile radius of the MSA’s epicenter
[5] MSA = metropolitan statistical area
[6] Elsewhere we’ve shown that the average overall deductible for a given level of premium is substantially higher under 2014 HIE plans than in prior year’s individual coverage plans; that out-of-pocket prescription costs (deductibles, co-pays, and co-insurance rates) are substantially higher in HIE plans; and, that drug formularies are substantially more narrow in HIE plans
[7] Options include: allowing greater premium differences based on age, allowing higher out-of-pocket maximums, reducing the scope of benefits, increasing subsidies, increasing penalties, and/or merging the relatively poor HIE risks into an existing risk pool having better average risk


