

As further context to widespread speculation regarding a potential PFE/AZN merger, we analyze trailing and current levels of R&D productivity at both firms, and also assess whether the theoretical NEWCO has: 1) advantages as compared to the independent firms; and/or 2) a current pipeline that can be expected to produce enough new product flow to maintain the NEWCO’s current level of sales
Economic Returns to R&D Spending
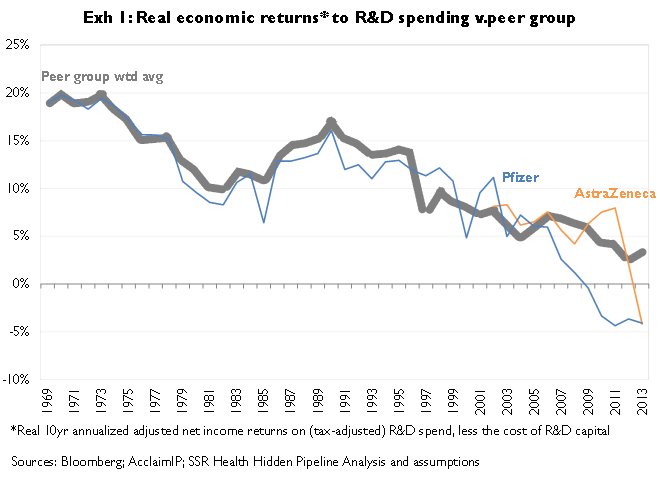
We define economic returns to R&D spending as the relationship between Year1 R&D spending and Year 10 adjusted operating income[i]. The beauty of this metric is that it captures R&D across the entire enterprise; it reflects not only R&D spending, but also reflects all costs (e.g. COGS, SG&A) required to commercialize the products resulting from R&D
Since 1969 PFE’s economic returns to R&D spending have tracked just below those of industry peers[1], falling more significantly below the peer average since roughly 2004. Measured since 2001 AZN’s returns have tracked the peer average with the exception of 2013[2] (Exhibit 1). The simple conclusion is that PFE and AZN would enter a combination as companies that had produced par to slightly less than par economic returns to R&D spending. On this metric, the only potential benefit the NEWCO would have as compared to the independent legacy companies would be the tendency for post-integration NEWCO SG&A/sales and COGS/sales to be lower than the legacy companies’ averages. At a given level of R&D spending (and at a given rate of innovation per R&D dollar, see below), lowering COGS and/or SG&A as a percentage of sales increases the economic return to R&D spending

The potential for operating synergies to improve R&D returns has to be weighed against the tendency of larger firms to have lower levels of R&D productivity (Exhibit 1a)

Innovation Yield to R&D Spending
Where economic returns to R&D spending reflects R&D productivity across the entire enterprise, innovation yield to R&D spending measures R&D productivity more narrowly within the confines of the R&D operation. Crudely, the innovation yield to R&D spending can be thought of as the R&D dollar cost of a standardized (quality-adjusted) amount of innovation[ii]. Measured since 1988, the trajectory of PFE’s innovation yield to R&D spending has followed that of the peer group (Exhibit 2), though in aggregate across this time period PFE’s R&D spending per standardized ‘unit’ of innovation exceeded the peer group by 14% (Exhibit 3). Measured since 1992, AZN’s innovation yield to R&D spending lagged the peer trajectory until roughly 2005, and has since followed the peer trajectory (Exhibit 2, again). In aggregate, AZN’s R&D spending per standardized ‘unit’ of innovation exceeded the peer average by 50% (Exhibit 3, again)


All else equal, and judging from current rather than trailing levels of innovation per R&D dollar, the NEWCO – like PFE and AZN independently – would be expected to have an industry average rate of idea generation per dollar of R&D spent
Average Quality of Innovation
The average quality of innovation metric can generally be thought of as the rate at which a company’s patents accumulate citations from later-filed patents[3]. Measured since 1989, the average quality of innovation produced by PFE has generally tracked the peer average; by comparison AZN’s average quality of innovation was well below the peer average until roughly 1997, and has tracked the peer average since (Exhibit 4). All else equal a theoretical NEWCO would be expected to produce innovation of average quality (and, folding in the preceding argument, at average cost per idea)

Focus and Leadership
No single firm – regardless of size – can expect to have active discovery efforts in all possible research areas. Accordingly companies must focus their discovery efforts; and for those focused efforts to pay off, companies must achieve relatively high ranks (as a percent of total innovation) in the research areas they’ve targeted
To analyze companies’ levels of focus and leadership in target research areas, we first categorize companies’ quality-adjusted patents by research area[4], then identify which research areas account for the majority of a given company’s innovation, then finally identify the company’s rank in each of those key areas
In the 22 research areas that account for just more than 80 percent of PFE’s phase 2 and earlier innovation, PFE ranks among the top 3 competitors in all but 5 of these areas, and holds an average rank of 2.5. AZN is a top 3 competitor in 2 of PFE’s top research areas (Exhibit 5). By comparison, in the 24 research areas that account for just over 80 percent of AZN’s phase 2 and earlier innovation, AZN holds a top 3 rank in just 8 of these areas, and an average rank of 7.1. PFE is a top 3 competitor in 11 of AZN’s top research areas (Exhibit 6). If combined, 80 percent of the phase 2 and earlier innovation in a PFE/AZN NEWCO would fall into 26 key research areas. The NEWCO would hold a top 3 rank in all but 1 of these research areas, and would have an average rank of 1.8 (Exhibit 7) – which exceeds the current best average rank of 1.9 (BMY)


Internal Bias
Companies tend to favor their own discoveries when choosing lead compounds to place in human testing. This is a potent source of inefficiency, in that no company has such a lock on quality and quantity of discovery that it can afford to ignore lead compounds that might be: 1) better than the company’s internal discoveries; and 2) available for in-licensing
PFE generates about 3.1% of global biopharmaceutical innovation on a quality-adjusted basis; however 74.2% of its clinical trials involve compounds that PFE discovered – an ‘internal bias ratio’ of 24 (74.2% / 3.1%). AZN produces about 1.4% of global biopharmaceutical innovation on a quality-adjusted basis; however 59% of its clinical trials involve compounds that AZN discovered – an internal bias ratio of 42 (59.0% / 1.4%)
Is the NEWCO Pipeline Large Enough?
Consensus sales estimates for PFE’s in-line products fall by $9.8B from 2013 to 2020e; AZN’s in-line products are forecast to fall by $6.3B (Exhibit 8). Setting the bar for R&D output as low as feasible – to the level of product flow required to keep sales constant – we examine whether the companies’ pipelines are large enough to fill the gap

Exhibit 9 summarizes registered and phase III products for the two companies, as well as sales expectations for these products. If all registered and phase III PFE products are approved, PFE could expect $8.4B in additional sales by 2020, which is insufficient to fill the $9.8B gap. More realistically, if the attrition among these products is on par with past industry rates of late stage attrition, we would expect sales of roughly $5.4B – just over half the expected value of PFE’s gap. In the case of AZN, the best case (all products succeed) late stage consensus sales estimate is $3.5B as compared to a gap of $6.3B; the expected (attrition adjusted) consensus sales estimate for AZN’s late stage products is $2.3B, less than half the expected value of AZN’s gap

On a combined basis, the NEWCO would face a $16.1B drop in current in-line product sales by 2020, with a best case of $11.9B in new sales from late stage products, and an expected contribution of just $7.7B in new sales from late stage products
[1] ^ Defined as the 22 largest (by R&D spend) US-listed biopharmaceutical companies
[2] ^ The economic returns measure for any specific year is far less meaningful than the trend of the metric across multiple years (please explanatory endnote ‘i’). For this reason, the fall-off in the 2013 return metric for AZN should not necessarily be viewed as significant
[3] ^ Patents must refer to, or ‘cite’, earlier-filed patents that in any way limit or inform the claims made by the later-filed patents. Because of this, the rate at which earlier-filed patents accumulate citations from later-filed patents has signal value with respect to: 1) whether the earlier-filed patent is in an area of interest to other innovators; and 2) whether the earlier-filed patent makes claims that address subject matter relevant to claims desired by other innovators with later-filed patents. Citation accumulation rates vary by patents’ grant years; biomedical patents that accumulate citations more rapidly than other biomedical patents granted in the same year are assumed to be of higher quality, and vice versa. The average quality of innovation metric reflects the average quality of all patents granted in a specific year. Because patents granted recently are only beginning to accumulate citations, it is more difficult to estimate the lifetime pattern of citations (and thus quality) for younger patents. Our experience is that lifetime citation patterns for patents granted 5 or more years ago are reasonably predictable, but that lifetime patterns for patents granted within the past 5 years are relatively unpredictable. Accordingly we caution readers against relying on average quality metrics between 2008 and 2013
[4] ^ Specifically, we sort research projects according to the World Health Organization’s Anatomic, Therapeutic and Chemical (ATC) classification scheme. There are six levels of ATC code with increasing specificity (level 1 is body system; level 6 is specific drug); we sort projects into the most specific ATC code level possible at an acceptable level of accuracy. Projects can fall into multiple ATC codes, e.g. PCSK9 inhibitors will fall into relevant (and distinct) ATC codes for both monoclonal antibodies and cholesterol-lowering
[i] ^ Conceptually, this metric reflects the firms’ Discover → Develop → Make → Sell value chain, relating earlier R&D investment to later earnings. Research and development dollars are invested in the ‘Discover’ and ‘Develop’ steps, initiating value creation; and, further necessary investments (‘Make’, ‘Sell’) are made in order to commercialize the resulting products. The economic return on the earlier R&D spend is thus the subsequent (years later) earnings stream
More specifically, we compare year 1 R&D spend to year 10 adjusted operating income; for example the return on 1978 R&D spending is defined as 1987 adjusted operating income. To adjust operating income, R&D spend in the ‘payoff’ year is added back to operating income as part of the measured return. Sticking with the 1978 to 1987 example, in theory it is un-necessary to spend 1987 research dollars to capture the economic benefit of the products generated by 1978 research. All other 1987 expenses (e.g. COGS, SG&A, interest, cost of capital) are counted against the ‘payoff’, because these expenses are necessary to support the commercial lifecycle of products generated by 1978 research
Obviously the 1978 R&D spend results in products that should generate earnings across several years, so this metric cannot be read narrowly as a specific measure of productivity in a single year. Rather, by comparing year 1 R&D spend and year 10 adjusted operating income over multiple decades, we’re able to estimate two things: 1) representative economic return levels for a given ‘era’ of spend; and 2) the trajectory of economic returns to R&D spending over time
The ten year gap between investment (R&D spend) and return (adjusted operating income) is chosen because it approximates the distance between the mid-point of a single product’s R&D costs (even though spending takes place across more than a decade, the greatest spending occurs in development phases that precede launch), and that same product’s peak earnings (which occur at a mid-point in the on-market lifecycle, after launch costs are covered, but before competitive positioning erodes). This obviously is a rough approximation of the investment / return timeframe; however because our estimate of economic returns to R&D spending is fairly insensitive to the assumed gap between R&D spend and associated earnings, a rough approximation is defensible
The key benefit of this metric is that it is an enterprise-wide measure of R&D productivity, because it takes into account all associated costs, not just the direct costs of R&D. The key weakness of this metric is that its most recent values reflect returns on R&D investments made 10 years earlier, i.e. the metric is silent on economic returns to R&D spending within the last 10 years
[ii] ^ Where the preceding metric (economic returns) is an enterprise-wide measure of returns to R&D spending, innovation yield to R&D spending is a narrower measure of productivity within the confines of the R&D operation. Conceptually, this metric reflects the amount of innovation produced per R&D dollar spent
The patenting behavior of biopharma companies across the early- to mid-phases of discovery and development appears to be both comprehensive (i.e. all potentially promising ideas are patented) and consistent (the decisions of when to patent and what to patent are similar across companies). As a result patents – and in particular these patents’ citation patterns – offer a reasonable basis for comparing firms’ innovative output
We define the innovation yield of R&D spending as the amount of innovation produced in a given year, divided by the amount of R&D spent in that same year. More specifically, we define the year in which innovation is ‘produced’ as the year in which the patent describing that innovation is granted
The first limitation of this metric is that discovery precedes the patent filing, and that the filing precedes the grant – often by several years. As such, it’s important for readers to bear in mind that patents granted in a given year – and thus counted by this metric as being innovation ‘produced’ in a given year – in truth will have been made as many as several years earlier
The second limitation of this metric is that R&D spending in any given year will be heavily weighted to ‘D’, i.e. to development spending, which generally has more to do with commercializing ideas than with generating ideas. If we had access to ‘clean’ measures of research spending – sans development – we obviously would prefer a narrower metric reflecting the innovation yield to ‘R’ (i.e. research) spending only. Nevertheless the combined R&D spending measure is all we have, so we’re forced to work within its limits
The third and final limitation of the metric is that it is only accurate for grant years at least 5 years in the past. Because our measure of innovation output relies heavily on patents’ citation patterns, and because the citation patterns of patents less than 5 years old may change significantly across these patents’ lifetimes, our estimate of innovative output can be very noisy until approximately 5 years following the underlying patents’ grant dates. To remind readers that these more recent readings are less reliable, our graphics show the most recent 5 years’ observations in a shaded area
The benefits of the ‘innovation yield to R&D spending’ metric are that it allows us to estimate productivity within the confines of the R&D organization (it is roughly equivalent to the number of quality-adjusted ideas produced per dollar of R&D spend); and, despite its own time lag, it is a metric that can be used for more recent years (5 year lag) than the economic returns metric (10 year lag)