

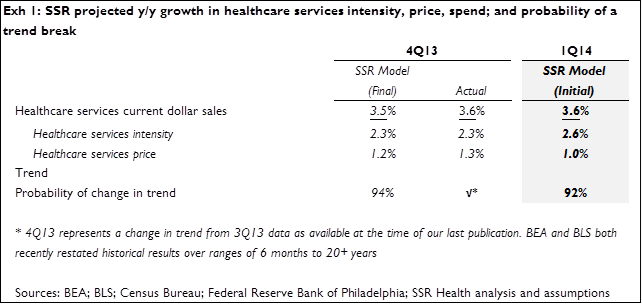
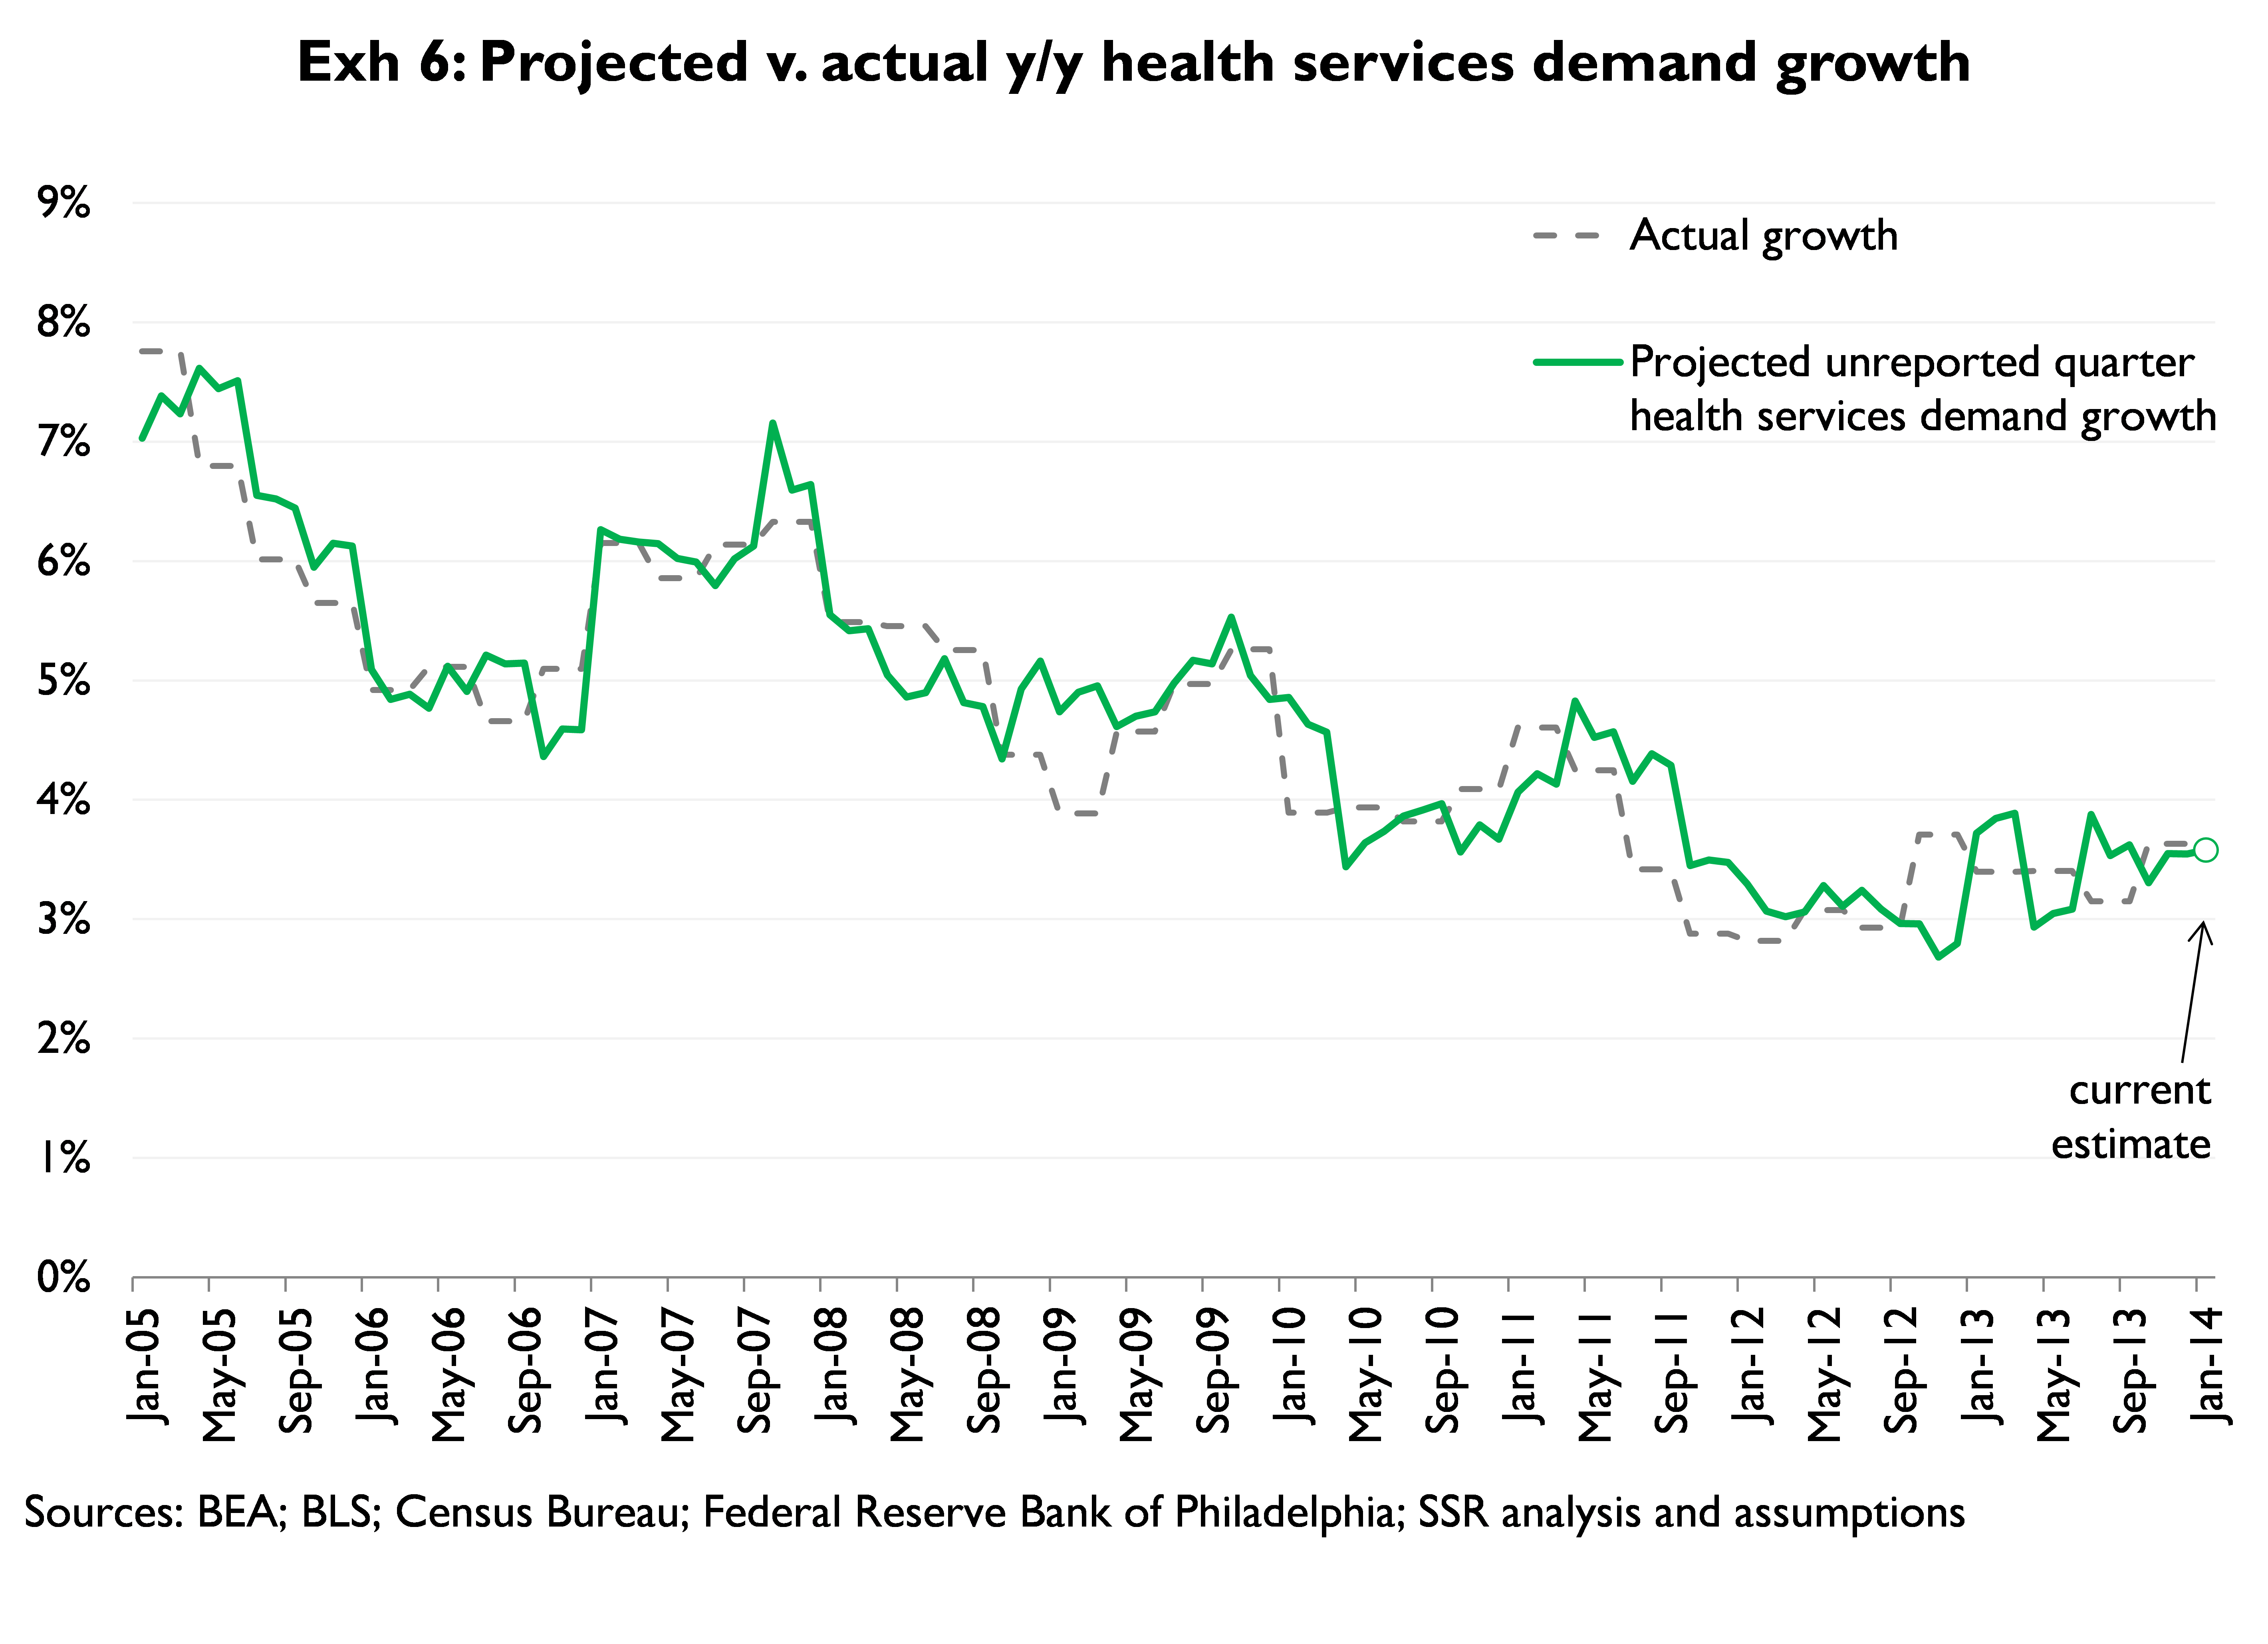
We expect 1Q14 health services demand growth (y/y, nominal) of 3.6%, the product of 2.6% growth in intensity demand and 1.0% growth in nominal pricing (Exhibit 1). Our estimate of y/y growth in intensity is 30bps above 4Q13 actual. Our nominal pricing forecast is a full 30bp below last quarter – and 10bp below the multi-year low observed during 3Q13. Separate from our growth rate forecast, we run an independent model which handicaps the odds of a trend break in demand. This model suggests a strong likelihood (92%) of accelerating (4Q13 v. 3Q13) demand
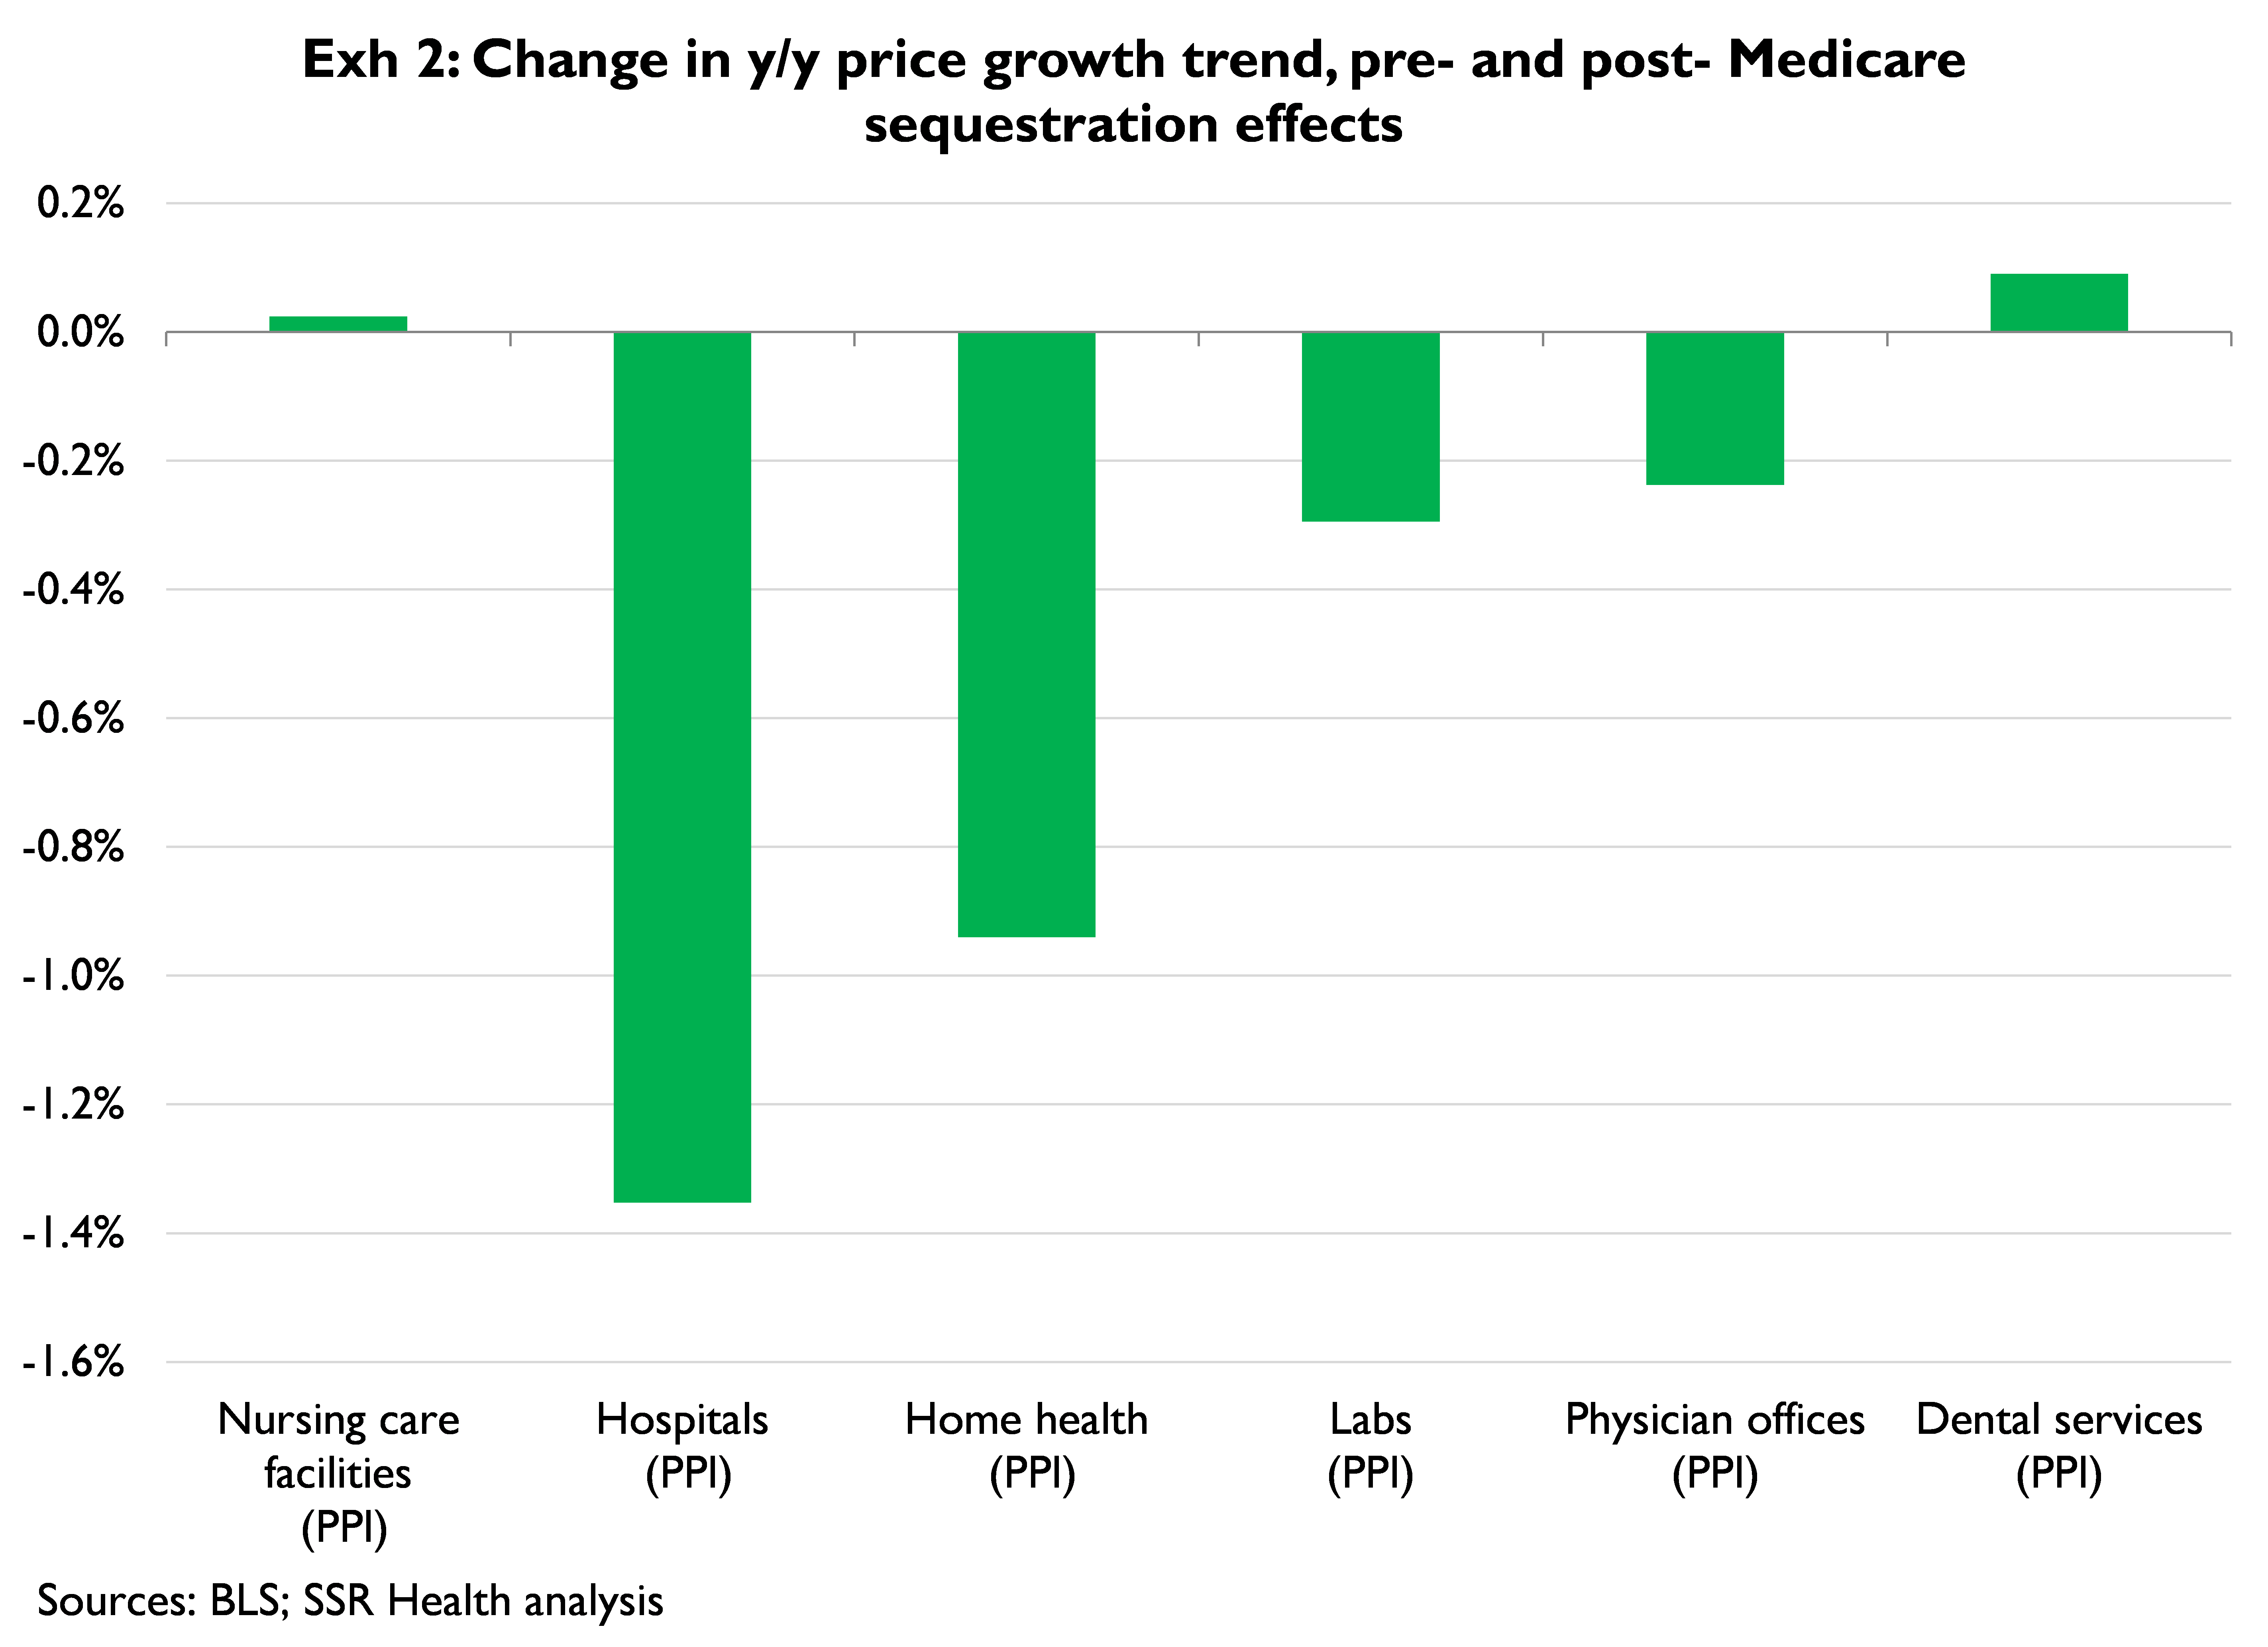
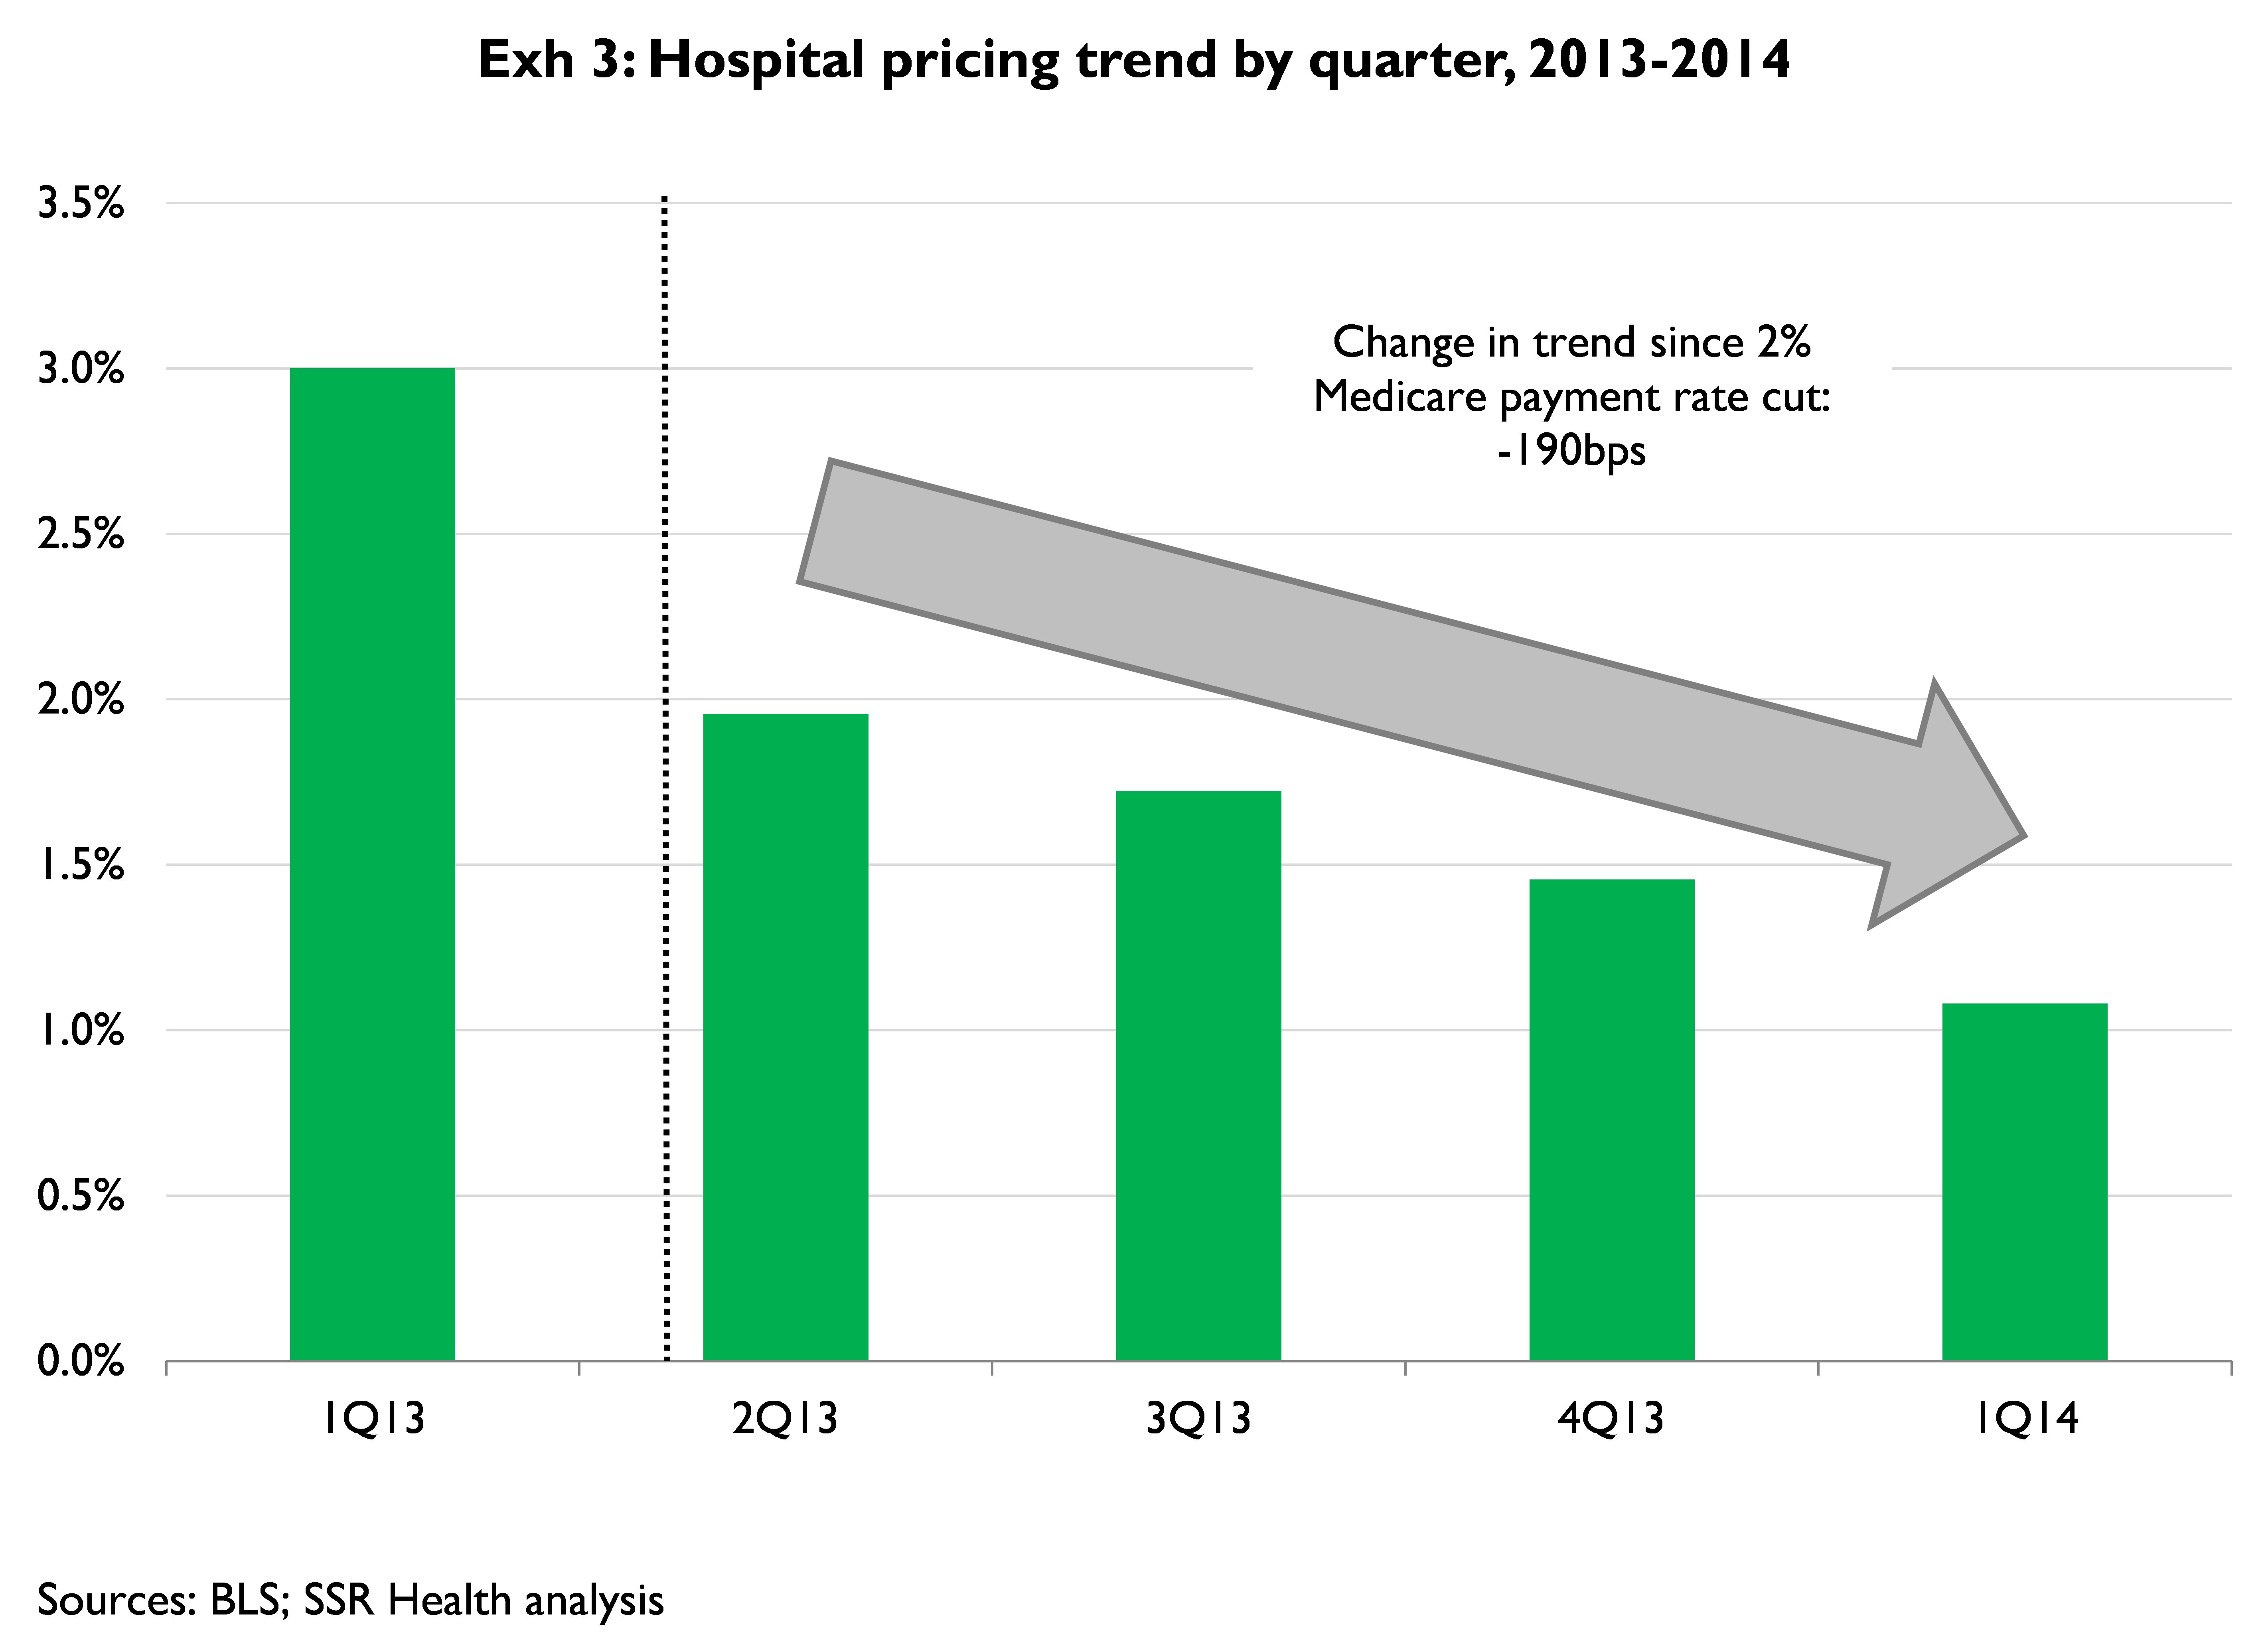
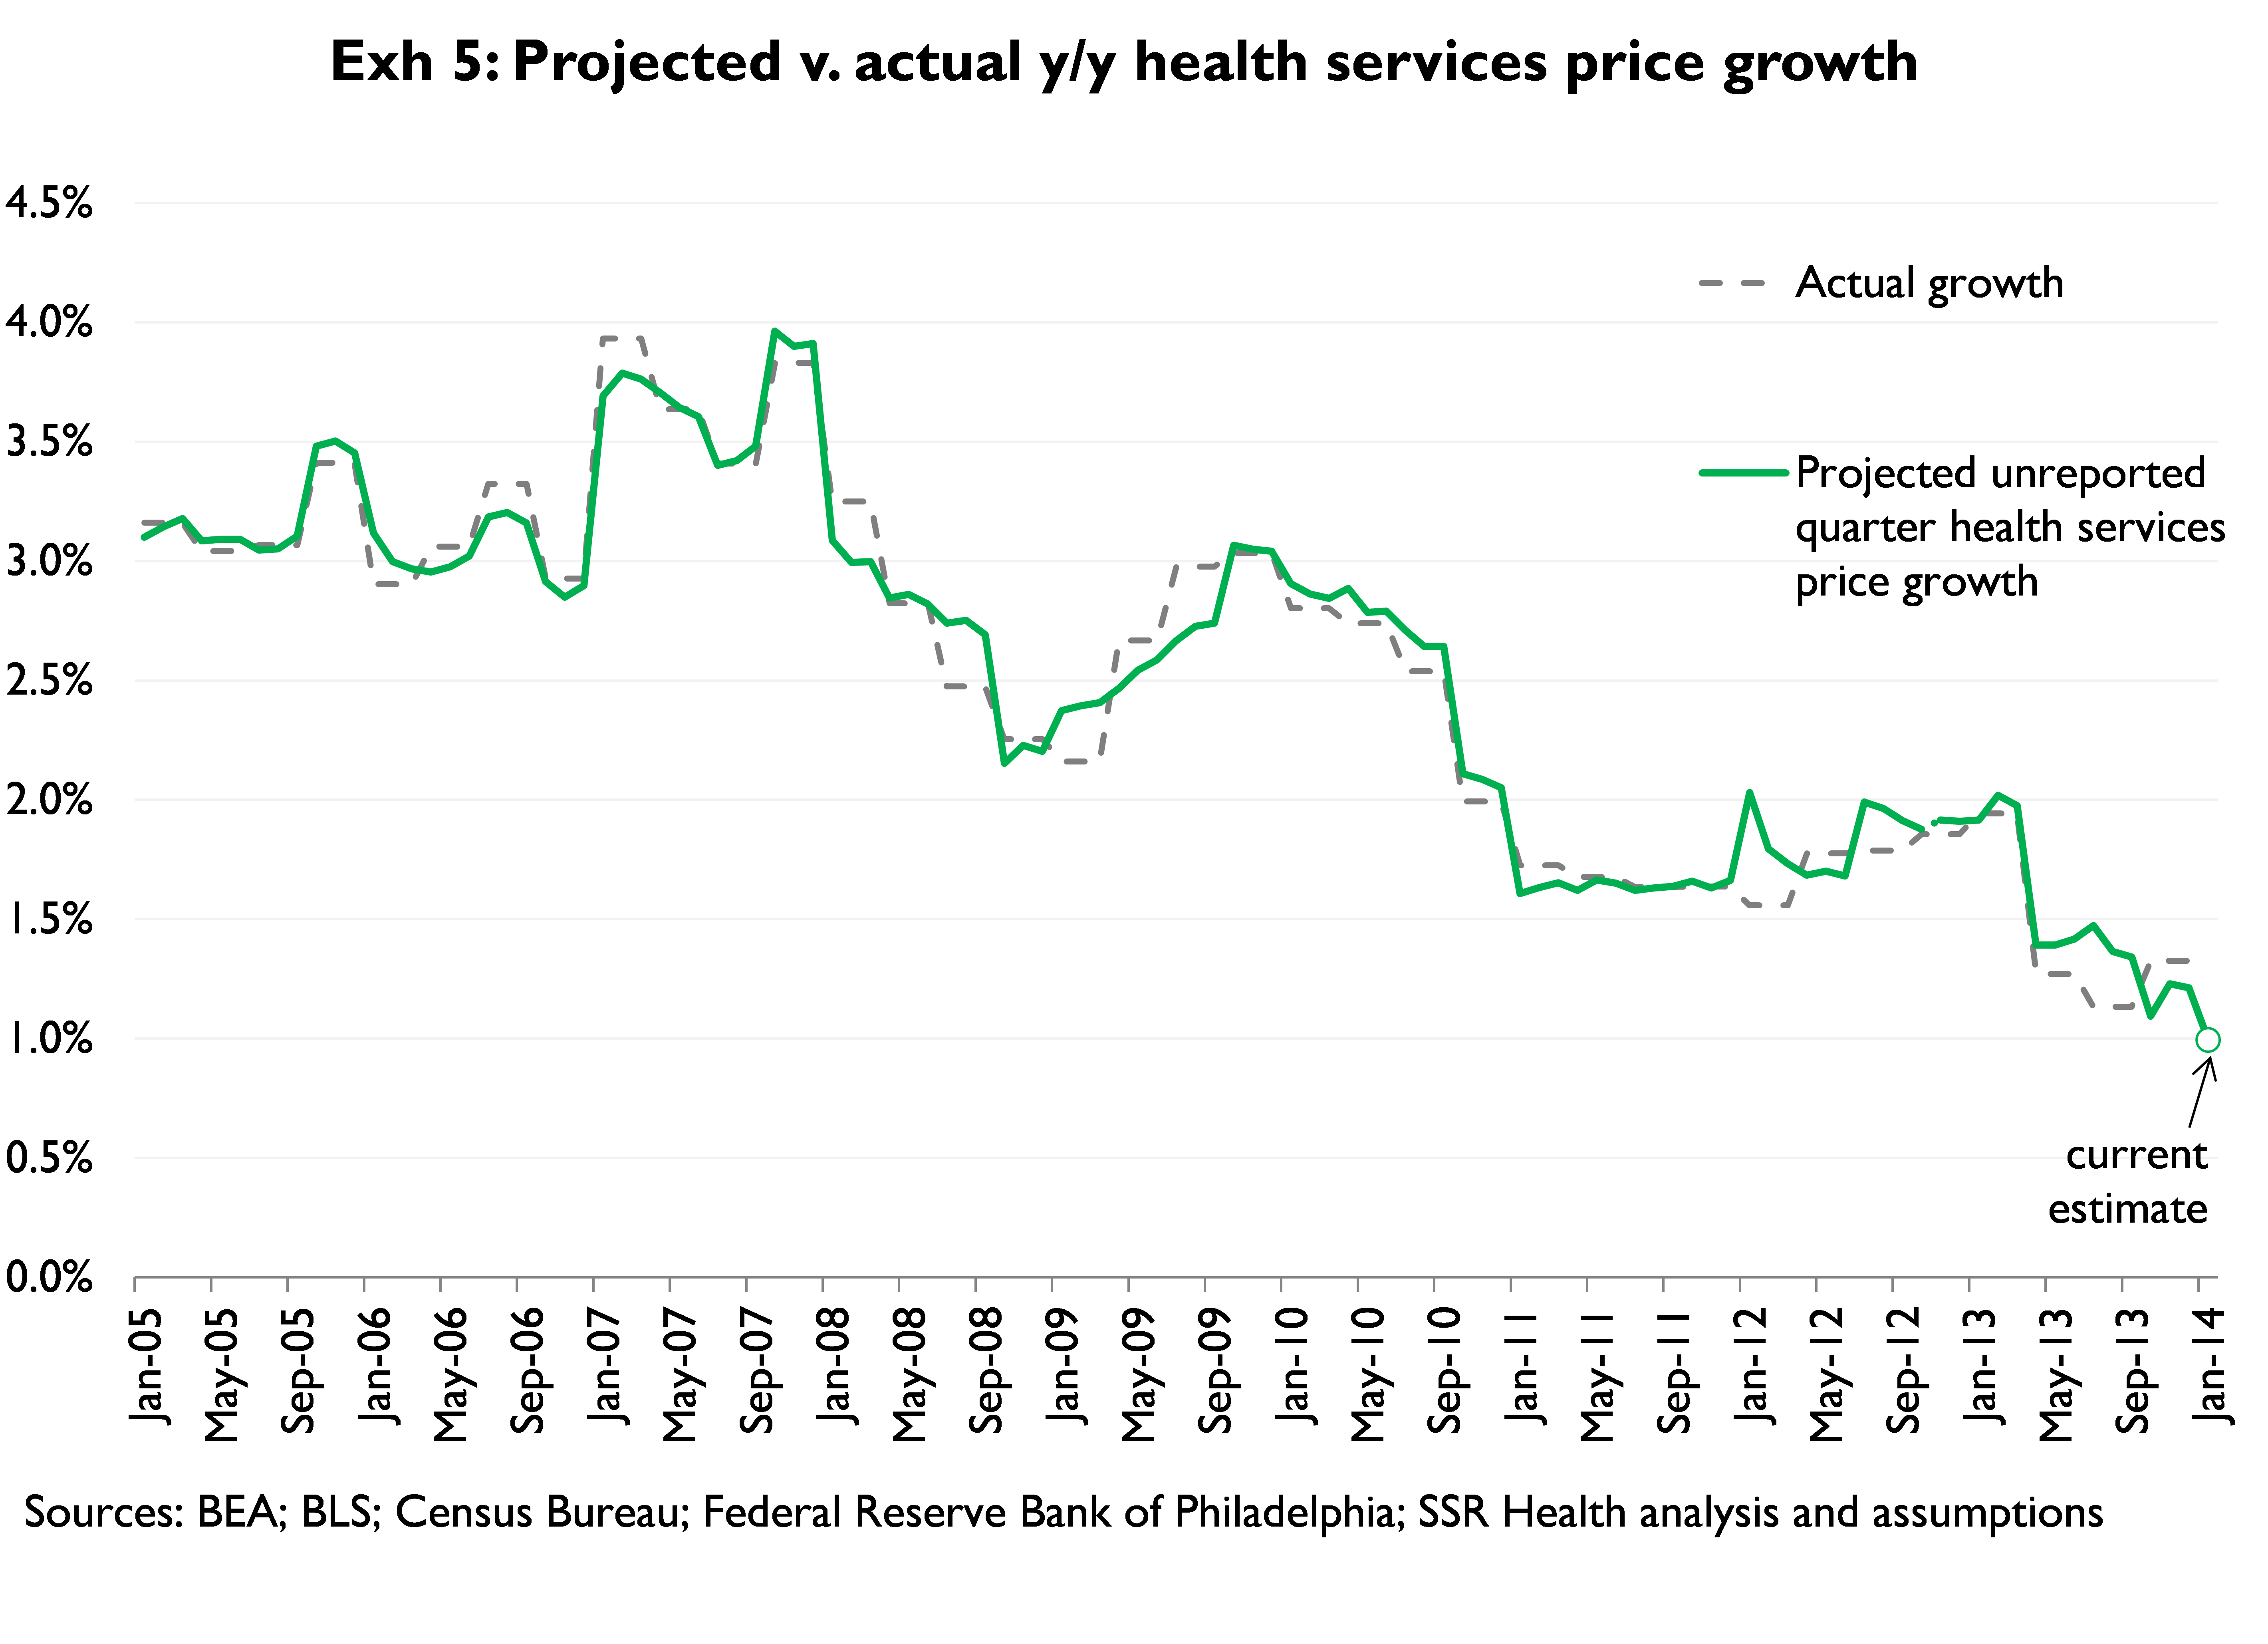
We continue to closely monitor the pricing trend, which has been extremely weak since the 2% across the board cut in Medicare provider payments began last April (and which were extended through 2023 in the bipartisan budget compromise passed in December) (Exhibit 2). The trend has not really moderated since the shock – particularly for Hospitals where, if the preliminary January PPI number holds up, pricing growth will be at its lowest point since 1998 (Exhibit 3). In the context of a slew of reform-related changes that should negatively affect net hospital pricing[1], this dynamic warrants continued close attention
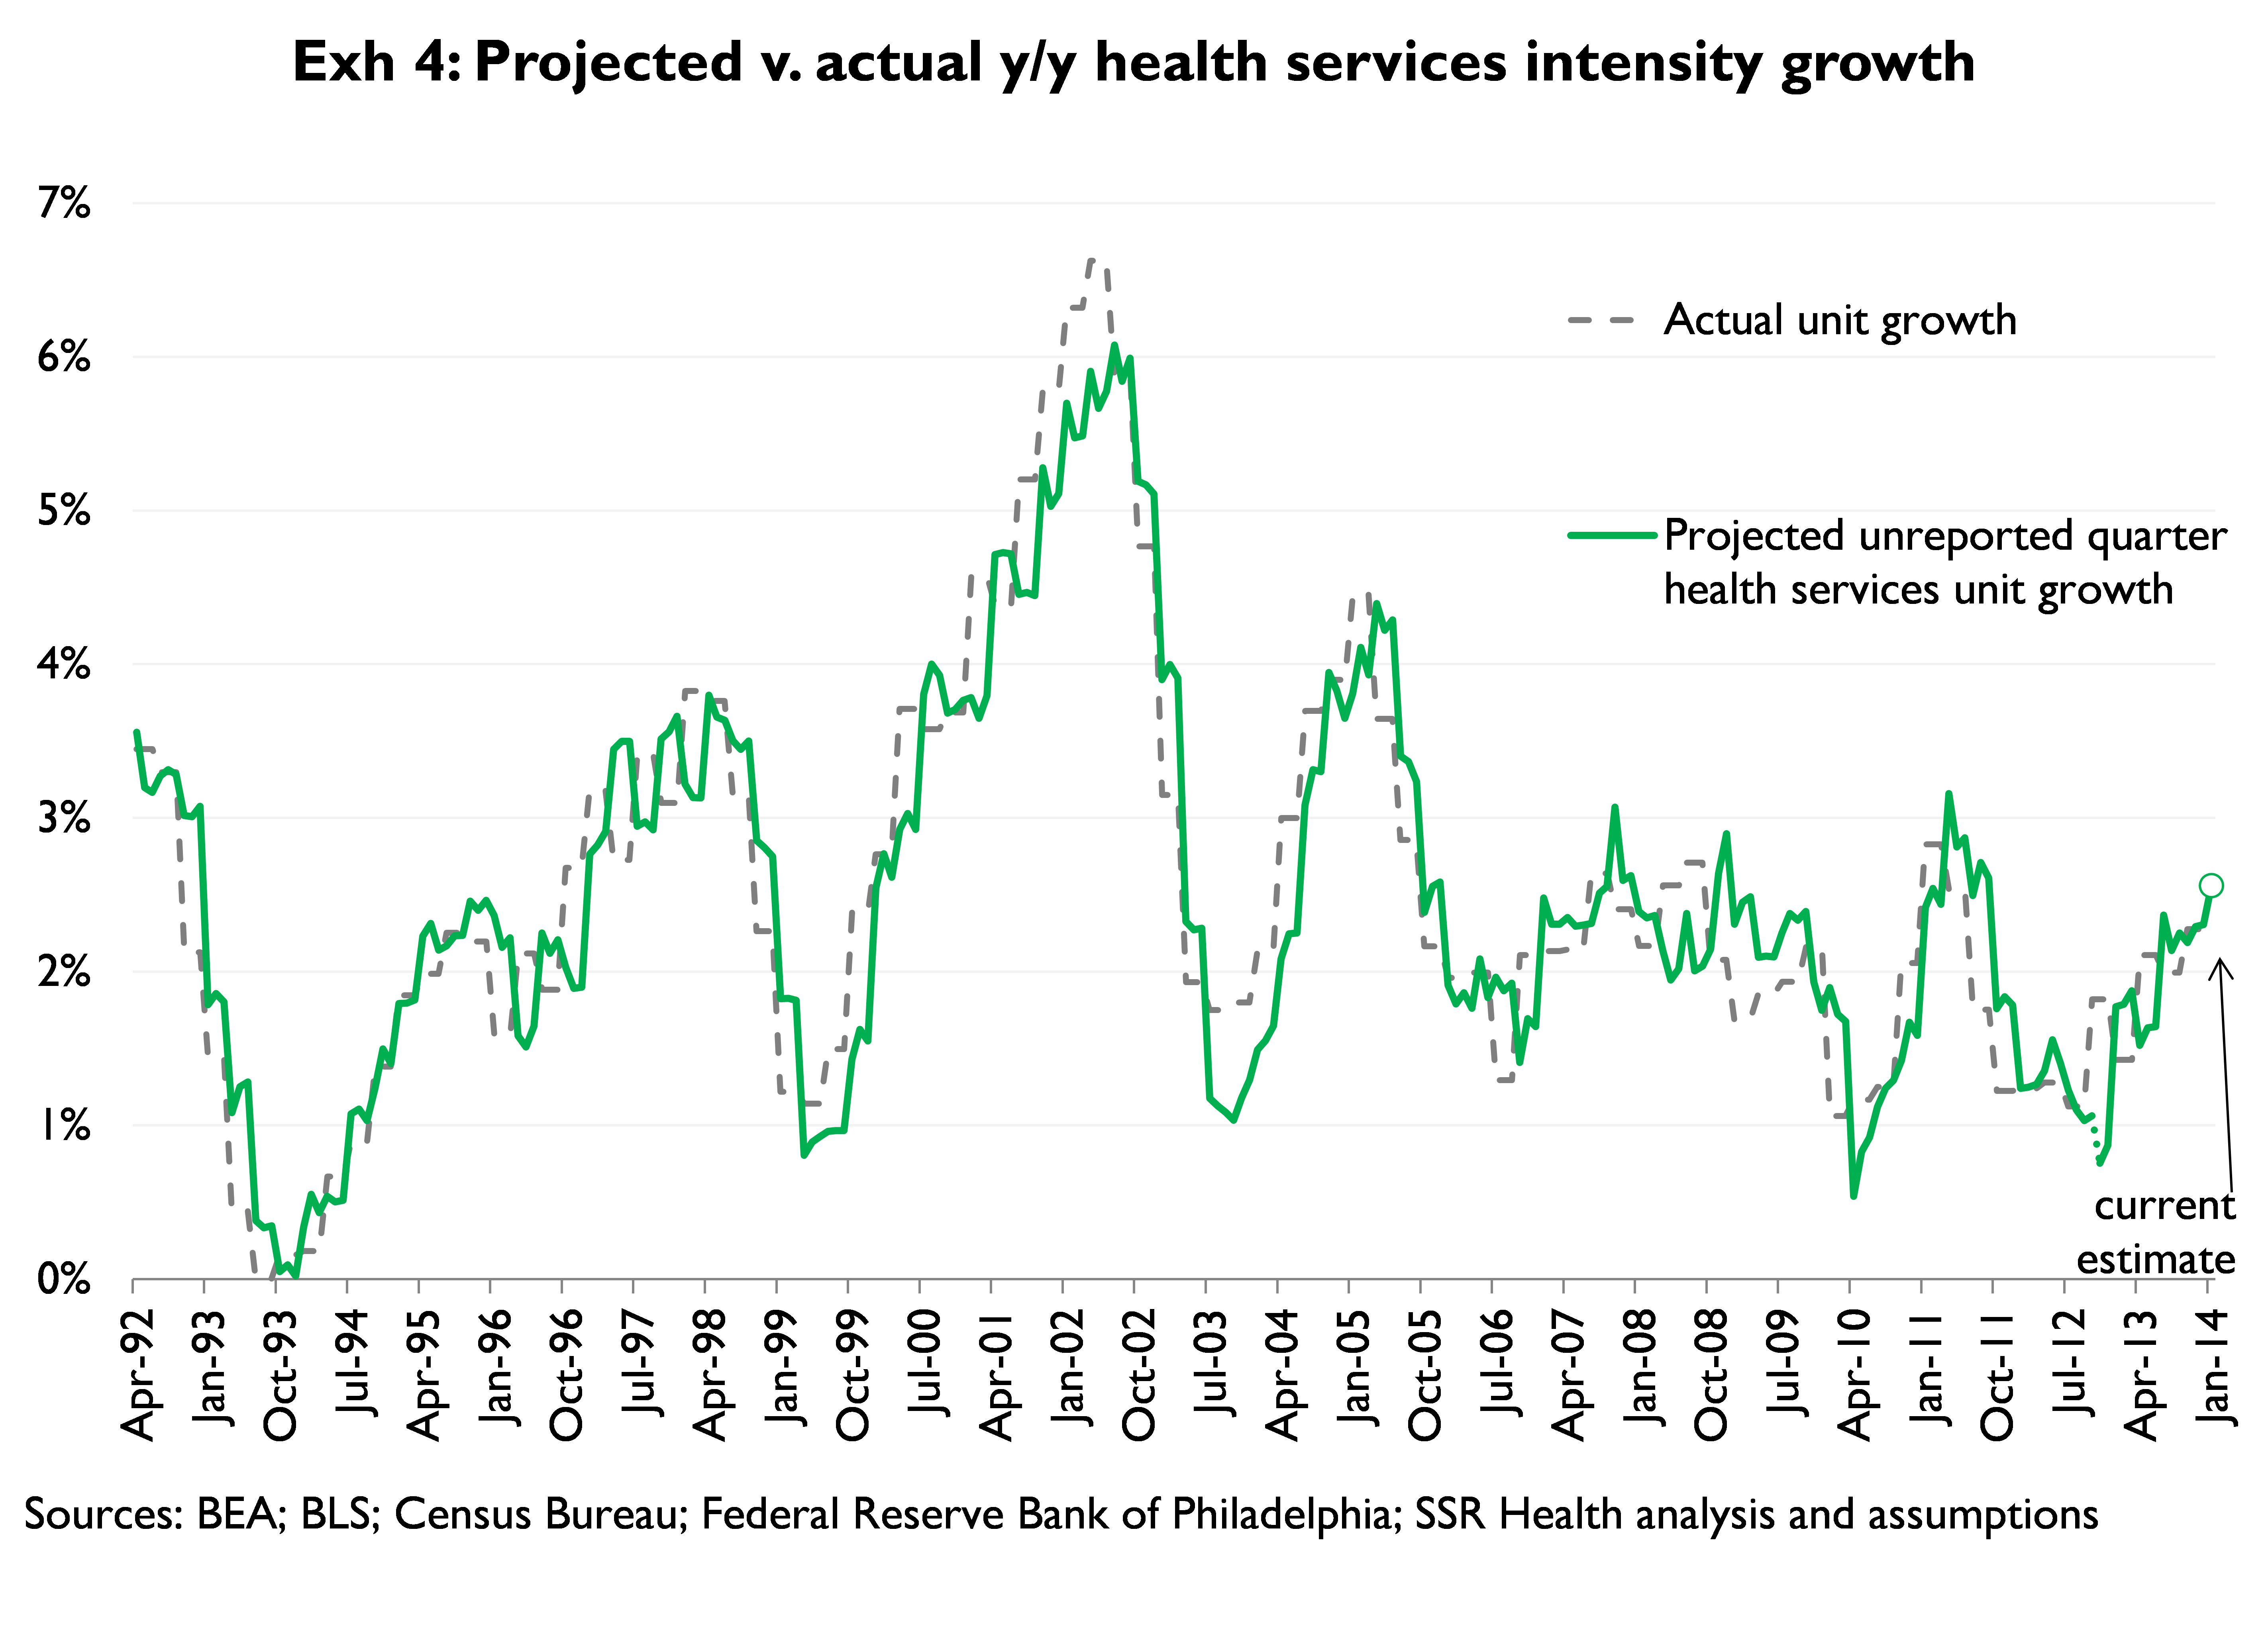
The projected improvement in intensity is largely a function of rising GDP growth forecasts in the Philadelphia Fed Survey of Professional Forecasters, and momentum in wages for health workers, both of which tend to rise with intensity growth
Our estimates of demand dynamics for health services rely on several measures of underlying economic activity; included among these variables are measures of general economic activity and health-system specific activity, as well as forward expectations about US economic conditions
Exhibits 4, 5, and 6 provide time series of actual v. projected unit demand, price growth, and total demand, respectively
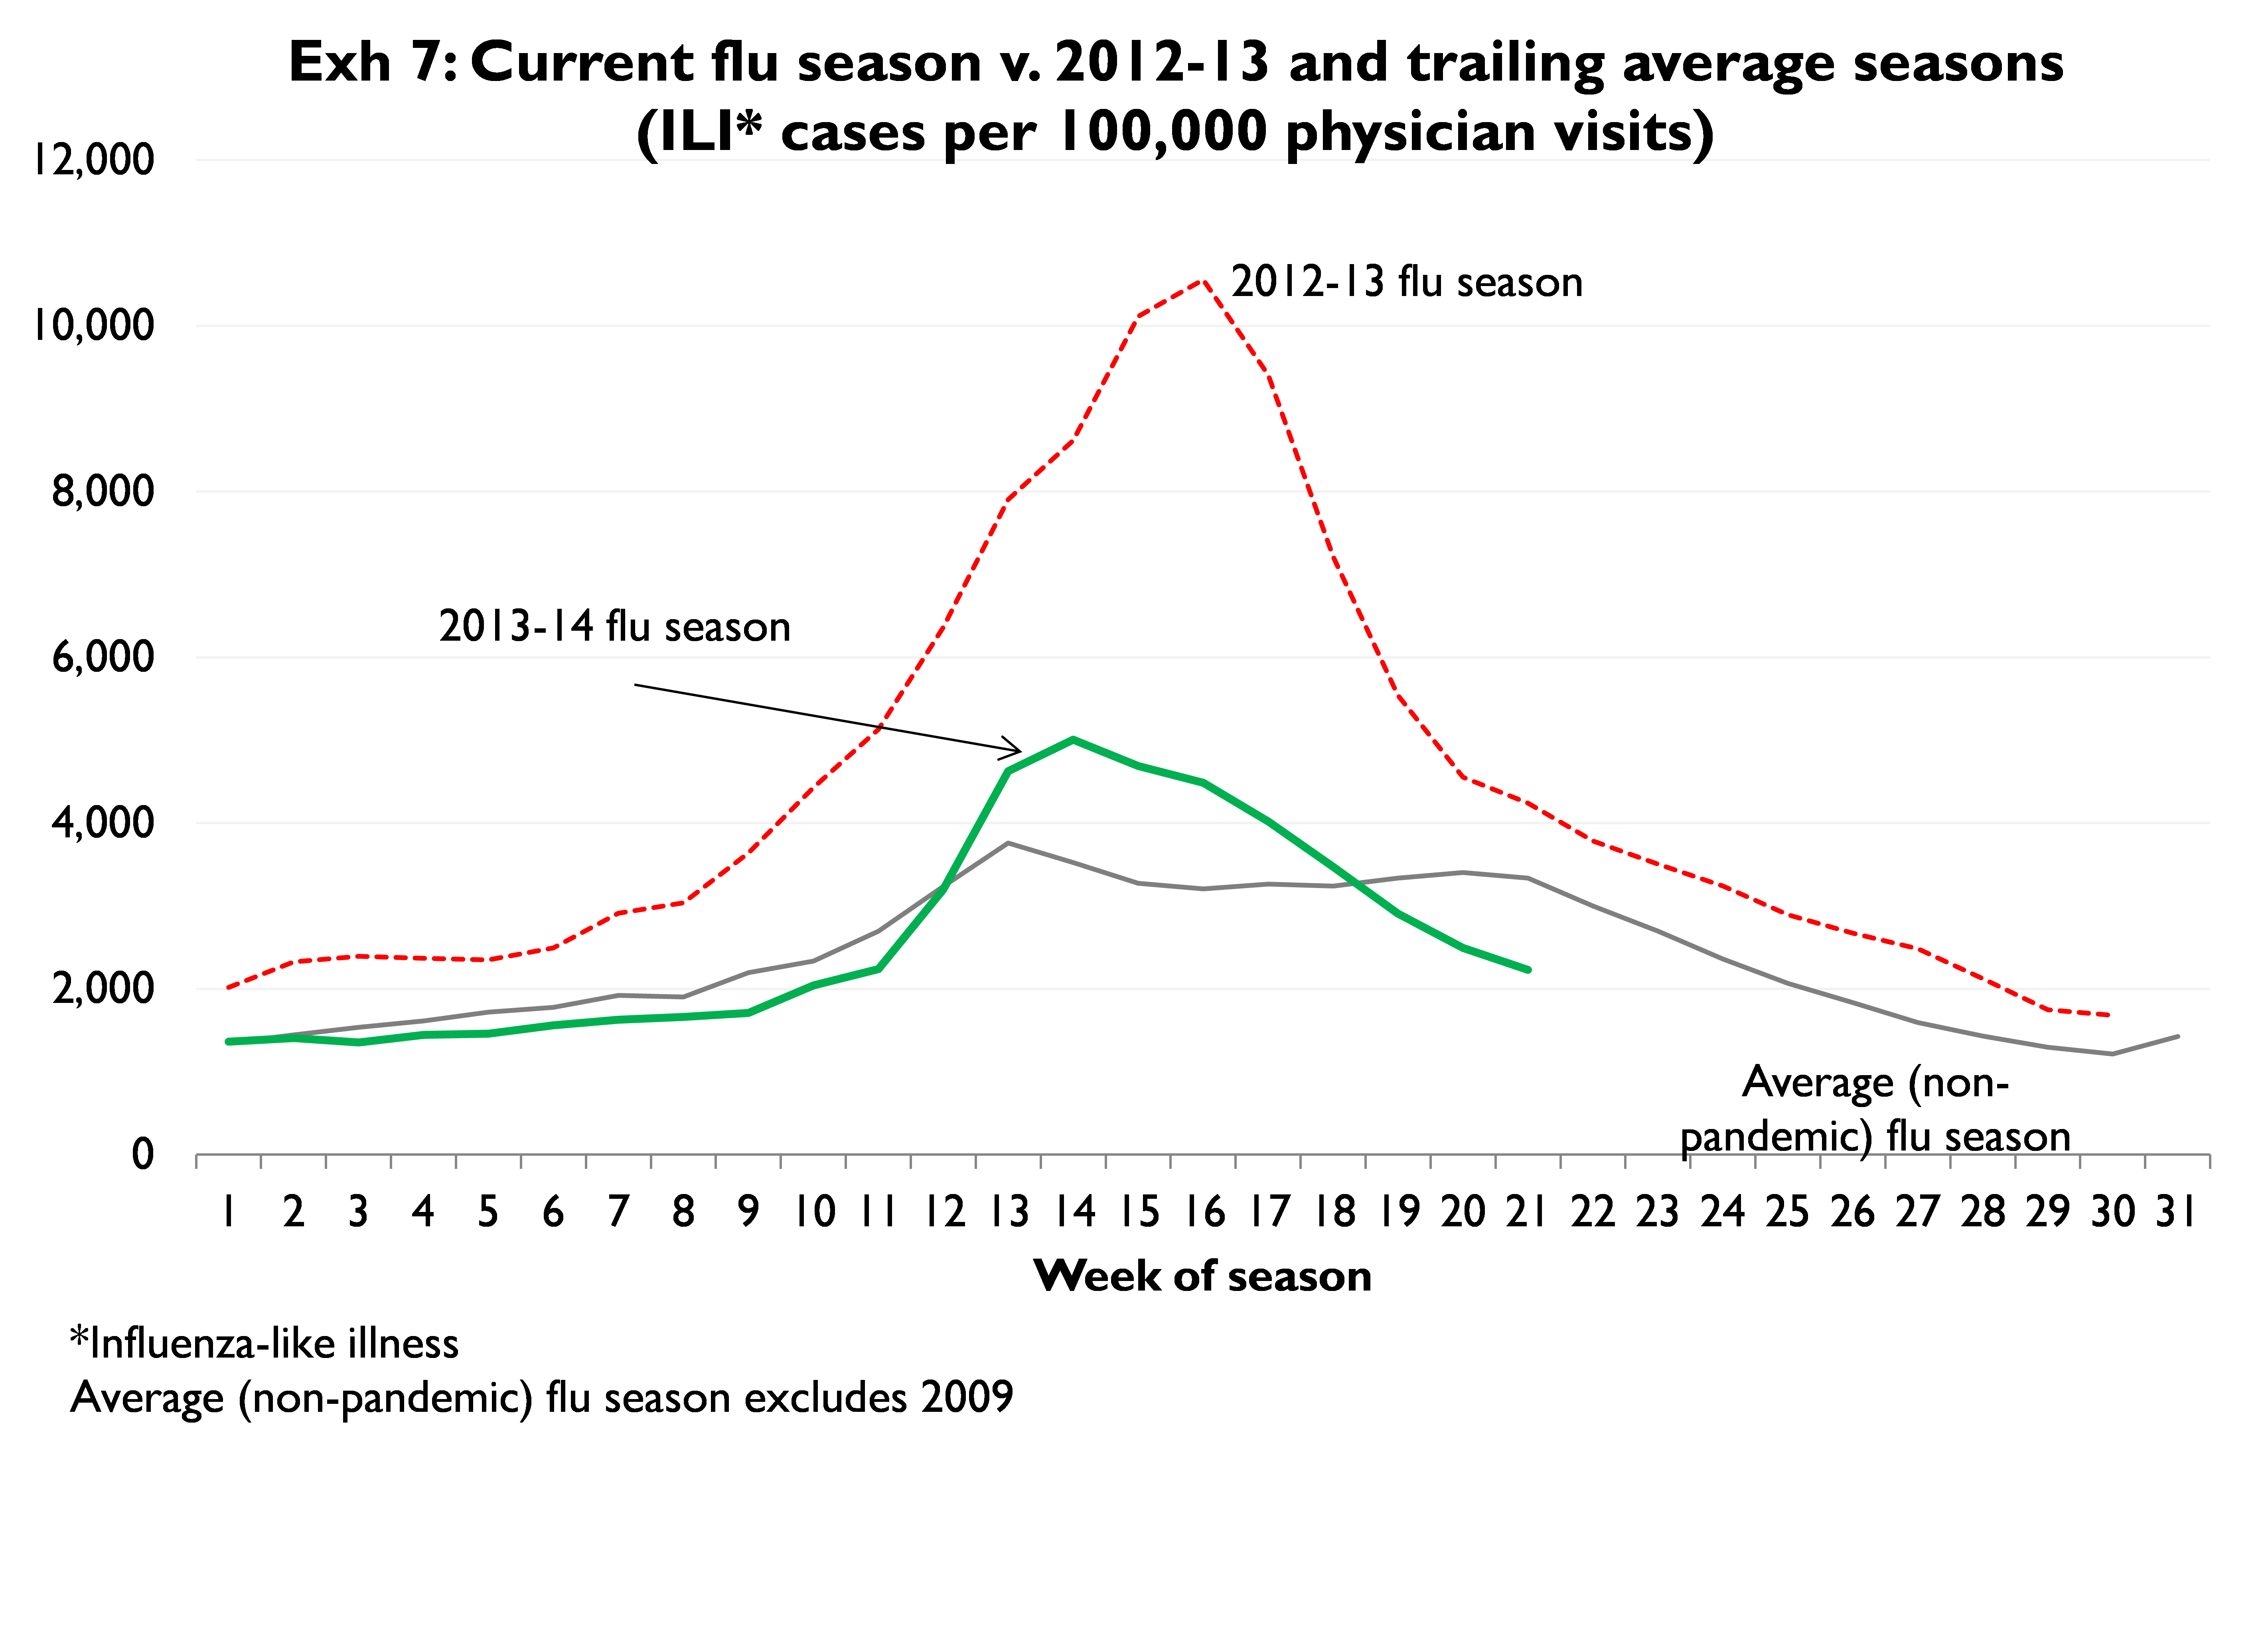
2013-2014 Flu Season
This flu season has been notably difficult to characterize. It started very slowly, but through December turned significantly more intense. However, since ILI[2] cases peaked around New Year’s, the season’s intensity has fallen just as quickly and precipitously as it rose (Exhibit 7). Over the last 3-4 weeks, the season has become much less severe than is typical (for this point in the year). Despite the noisy time series, on net it is fair to characterize this season as fairly average. As such we point to our long-held argument that a return to an ‘average’ flu season in 2013-14 translates into a +/- 30 bps headwind for total y/y health services demand growth during 4Q13-1Q14
[1] Including expansion of low-reimbursement Medicaid, narrower exchange plan networks, and higher commercial deductibles, higher out-of-pocket costs which yield lower collection rates. For more detail, see “Hedge Hospital Pricing Risks with Non-Rx Consumables,” SSR Health, 3/11/2013
[2] Influenza-like illness