Summary and Conclusion
In light of the recent change in MRK’s R&D leadership, and evidence[1] that the company may be planning a significant change in its approach to R&D, we thought it would be informative to compare R&D performance over time at MRK and AMGN (whose R&D was managed from 2001 to 2012 by Roger Perlmutter, who took over at MRK in March of 2013)
We find:
MRK has produced lower economic returns[2] to R&D spending than its peer group[3] over the last decade, where AMGN produced superior economic returns v. peers
Over the last twenty years MRK spent 1.76x more per standardized ‘unit’ of innovation than its peers ($52.0M per quality adjusted patent for MRK, v. $29.6M for peers), where AMGN’s spending per ‘unit’ of innovation was on par (0.94x) with peers
MRK’s ‘cost per unit of innovation’ disadvantage versus peers is worsening; AMGN’s par status on this measure is stable
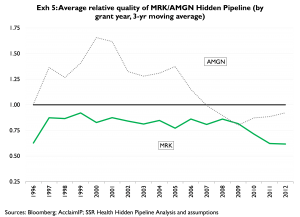
The apparent quality of innovation produced by AMGN over the last 17 years is substantially greater than the peer average; however since 2007 AMGN has fallen slightly below the peer average. The apparent quality of MRK’s innovation over the last 17 years lags the peer average in every year; and, MRK’s performance on this metric appears to be further deteriorating since 2009
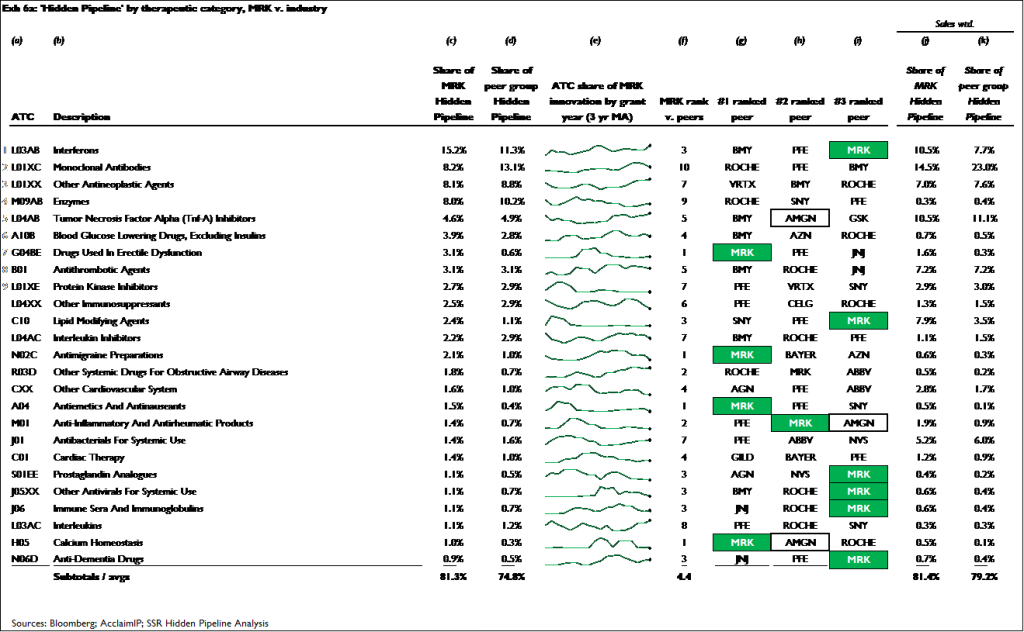
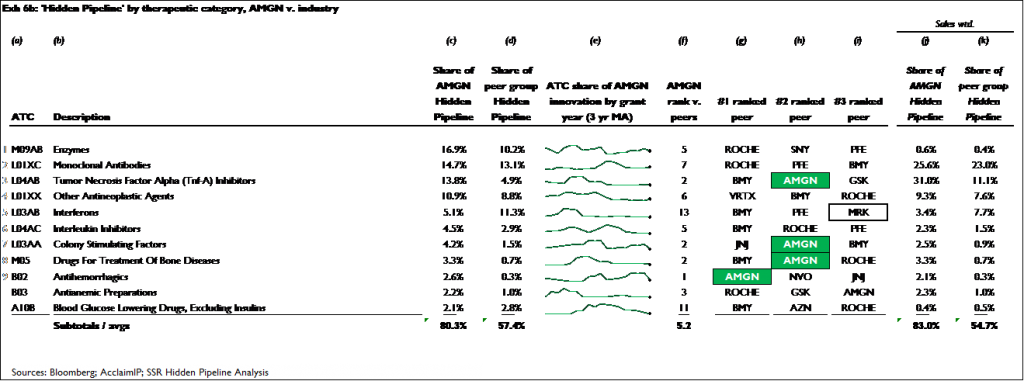
Both companies have achieved similar degrees of leadership in the mid- to early-stage research areas they currently focus on. Across the 11 research categories that account for more than 80 percent of the innovation in AMGN’s pre-phase III pipeline, AMGN has a top 3 rank in 4 of these areas, and an average rank of 5.2. Across the 24 areas that account for more than 80 percent of the innovation in MRK’s pre-phase III pipeline, MRK has a top 3 rank in 10 of these areas, and an average rank of 4.4
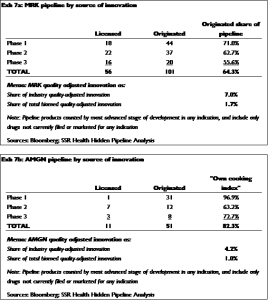
An emerging theme of MRK’s possible R&D restructuring is a greater focus on insourcing discoveries from other companies. At the moment, neither company is efficient in this regard. MRK’s discoveries account for only 1.7% of the quality adjusted biopharma innovation currently under active patents in the US; however more than 64% of the compounds that MRK has in clinical development were discovered by MRK. This suggests that a MRK discovery is 37x more likely to be placed in development by MRK than a compound of similar quality and commercial quality discovered elsewhere. This internal bias is even more severe at AMGN, who generate 1.0% of quality adjusted biopharma innovation, but whose own discoveries account for 82.3% of its development pipeline
These findings suggest that AMGN historically has produced high quality ideas at a level of ‘per-idea expenditure’ that is on par with peers. In other words, AMGN spent as much per idea as its peers, but on average generated better ideas. Conversely, MRK spent substantially more per idea than peers, and produced ideas that were on average of lower quality. Only by spending very large amounts of money on relatively inefficient R&D has MRK developed a competitive early- to mid-stage pipeline
Setting aside chance, and the general tendency of large-molecule oriented R&D programs to be more productive than small-molecule oriented programs, it stands to reason that AMGN’s better (v. MRK) R&D performance may be due to different management approaches taken by the two companies during the periods we analyzed. By extension, it stands to reason that shifting the MRK R&D approach toward the AMGN approach is likely to raise MRK’s R&D productivity
We would emphasize that ‘par’ R&D productivity is a +/- negative 7% — thus despite being more productive than MRK, AMGN’s recent R&D productivity of ‘par’ or slightly above is inadequate in terms of financial returns. Thus MRK must do more than simply close its historic R&D productivity gap v. AMGN
Economic Returns to R&D Spending
R&D spent today leads to the creation of products that create profits tomorrow. Accounting for the length of discovery / development cycles, and the relative expense levels at various points across the R&D cycle, we believe peak profits from research in Yr0 occur in +/- Yr10. Thus by simply comparing Yr0 R&D spending[4] to Yr10 adjusted[5] net income, we can roughly estimate economic returns to R&D spending, and can (a bit less roughly)[6] estimate the trajectory of a company’s economic returns to R&D spending
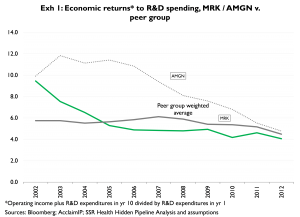
Exhibit 1 provides the values for both AMGN and MRK, and for the peer group. AMGN’s economic returns exceeded those of peers (and MRK) in all years, though beginning in 2011 AMGN’s performance nears par with peers. MRK’s economic returns exceeded those of peers only in the first 3 years of the comparison, and have been below peer group levels in each of the 8 years since
Importantly, Exhibit 1’s x-axis reflects the Yr10 of the Yr1/Yr10 comparison – i.e. it reflects the year in which the R&D returns were realized rather than the year in which the R&D investment was made. Accordingly, the analysis in Exhibit 1 is backward looking, and prone to miss any changes to R&D productivity that may have occurred since 2002
(Apparent) Innovation per Dollar
At the discovery level, Drug and Biotech companies’ patenting behaviors are relatively consistent and thorough – compounds (or compound families) that show promise are claimed in patents well before these products reach human testing, and thus well before these projects are disclosed in media generally used by investors
By analyzing patents[7], we can index the apparent amounts and types of innovation in companies’ ‘hidden’ (i.e. pre-phase III) pipelines. And, by comparing these measures of innovation with R&D spending, we can get a sense of how efficiently companies are generating new ideas
Over the last 20 years, MRK spent $52.0M in R&D for each quality-adjusted patent it was granted in that same period, which is 1.76x the peer group average of $29.6M. Over the same period AMGN spent $27.8M per quality-adjusted patent granted, which is 0.94x the peer group average (Exhibit 2)
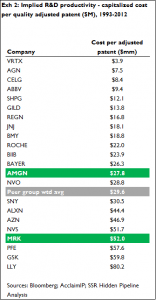
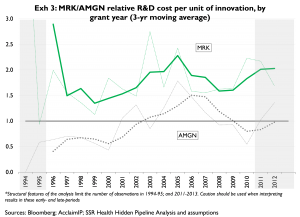
Exhibit 3 expresses the same R&D dollar per innovation data on a relative basis, over time. The x-axis represents the companies’ relative R&D spending per quality-adjusted patent, as compared to peers. MRK’s ‘unit cost of innovation’ has been substantially above the peer group average in all years since 1994. By comparison, AMGN’s unit cost of innovation essentially moves around the peer group mean
Exhibits 4a and 4b offer a slightly different look at unit cost of innovation over time. Here we compare the companies’ shares of peer group R&D
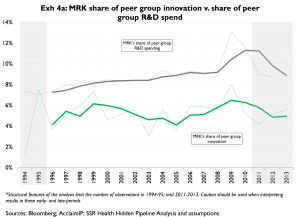
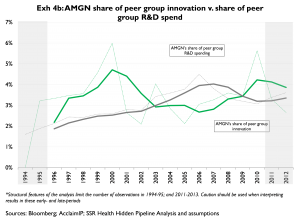
Importantly, in Exhibits 3 and 4 R&D is measured in the year it is spent, and innovation is grouped according to the year the patents underlying that innovation were granted. It should be kept in mind that in any given year granted patents are more reflective of research (‘R’) spending than of development (‘D’) spending; and, that development spending is by far the larger portion of R&D. For this reason, we read these exhibits as indicators of longer-term trends, rather than as indicators of R&D productivity in any given year. Also, because a company’s share of peer group innovation relies heavily on citations that accumulate on that company’s patents, and because citations take time to accumulate, our estimates of companies’ spending (grey lines) to their shares of peer group innovation (green lines). Companies with higher shares of spending than of innovation (e.g. MRK, 4a) are less productive than peers; companies with similar shares of spending and innovation (e.g. AMGN, 4b) are similarly productive as compared to peers shares of peer group innovation are inherently noisy for recent years. Accordingly we tend to place much less emphasis on innovation measures from the most recent years
Quality
As part of our dataset that assesses pre-phase III ‘hidden’ pipelines, we score patents according to relative quality. Here again we rely heavily on citations; the general idea with our quality metric is that higher quality patents will accumulate citations at a faster rate than lower quality patents[8]
Thus our quality measure can be thought of generally as the average rate at which a company’s ‘hidden’ pipeline patents accumulate citations, as compared to the peer group average
(Exhibit 5). From 1997 to 2006 AMGN scored substantially higher than the peer group average; however AMGN’s score has been slightly below par since 2007. Conversely, MRK’s score has been consistently below the peer group average, and if anything has worsened since 2008
Competitive Positioning
Of the hundreds of research areas we track, companies’ hidden pipelines tend to be concentrated in relative few areas. For obvious reasons it’s important for companies to establish leadership positions in the research areas they choose
We determine which research areas a company is focused on by simply ranking the research areas in descending order according to the percentage of the company’s total hidden innovation represented by that area. We then rank the company within each of these research areas by comparing its share of totally quality adjusted innovation in each specific area to its competitors’ shares of innovation in the same areas
Exhibits 6a and 6b show the results for MRK and AMGN, respectively. Across the 25 research areas that account for just over 80 percent of MRK’s total hidden pipeline innovation, MRK ranks among the top 3 in 11 of these areas, and has an average rank of 4.4. Across the 11 research areas that account for just over 80 percent of AMGN’s hidden pipeline innovation, the company has a top 3 rank in 4 of these areas, and an average rank of 5.2
Bias
As is typical for all companies in the peer group, both MRK and AMGN appear to place very little emphasis on in-licensing
In theory, an efficient R&D organization would be nearly[9] agnostic as to the origin of the compounds it places in development, i.e. companies should develop the best discoveries they can find, regardless of where those discoveries came from
MRK’s quality-adjusted US patent estate accounts for about 1.7 percent of all of the quality-adjusted biopharma patents currently active in the US — which is to say that MRK’sdiscovery operations generate roughly 1.7 percent of the total innovation in the global biopharma industry[10]. Thus if MRK’s process of choosing which discoveries to place into development were perfectly agnostic as to the origin of the discovery — i.e. if MRK chose compounds to develop based solely on the quality of the discovery — we would expect MRK discoveries to represent exactly 1.7 percent of the compounds under development by MRK. In fact, MRK discoveries are 64.3 percent of the compounds in MRK’s clinical development program – a 38x bias (Exhibit 7a). For AMGN, the figures are more extreme – the company generates about 1.0 percent of global biopharma innovation, but its discoveries account for 82.3 percent of the compounds under – an 82x bias (Exhibit 7b)
For the moment, we’re going to avoid going headlong into the argument about whether in-licensed compounds are more expensive. Plainly these require up-front payments, plus milestones and/or royalties that are not required of compounds discovered internally – and in that sense might be viewed as more costly than internal discoveries. However this simple framing misses the more complete question of whether the acquisition costs of licensed compounds are higher or lower than the direct costs of generating compounds internally – and there’s plenty of evidence in-licensing may actually be cheaper
We would also emphasize that the number of scientific disciplines engaged in discovery is growing – and that is has for a very long time been impossible for a single company to be truly world class in every attractive discipline. Because of this, we assert that companies whose development pipelines are overwhelmingly stocked with their own discoveries are almost certainly burdening development with many compounds that are inferior to those available from other laboratories
[1] Peter Loftus and Jonathan D. Rockoff, Wall Street Journal December 27, 2013: “Merck Plans Radical Overhaul of Drug R&D Unit”
[2] Roughly, this measure is equal to tax-effected R&D spending in Yr0, divided by adjusted net income in Yr10
[3] The 22 largest publicly listed drug and biotech companies by R&D spend, excluding Japan
[4] Adjusted for tax effects
[5] We add Yr10 R&D back to Yr10 net income, the idea being that Yr10 R&D spending is an expense that is not required in order to realize the economic potential of products generated by Yr0 R&D (COGS and SG&A, conversely, are required)
[6] The measured percentage return on R&D spending is sensitive to the assumption we make regarding how long it takes for Yr1 R&D to produce peak profits; however, the shape of the relationship between past R&D spending and future net income is relatively insensitive to this assumption
[7] We do quite a lot more than count patents to measure levels of innovation. We rely heavily on citation patterns, as the number of citations accumulated by a patent (and originating from later-filed patents) is a well-established indicator of the relative values of patents that address inventions in similar fields. Additionally, we consider the relative market sizes addressed by patents – e.g. a very highly cited patent in a very small potential market may not be as valuable as a less cited patent whose invention targets a very large potential market
[8] Citations made by later-filed patents indicate two things about the cited patent: 1) that is likely to be in an area of discovery that is of interest to other researchers; and 2) that the patent makes claims that are relevant to the claims being made by the later-filed patent
[9] If we could ignore the costs of insourcing compounds, we would argue that companies should be perfectly agnostic as to the origin of compounds placed in development. We recognize these costs cannot be ignored – but would also point out that some strong evidence suggests in-licensed compounds might actually be cheaper than internal discoveries
[10] We can narrow our analysis to US patents only, because of the extreme degree to which US patents reflect the same discoveries patented and developed on a global basis
