

 Health insurance exchange (HIE) enrollment levels through December 28 remain quite low. States operating their own exchanges enrolled 1.0M persons, equivalent to 7.4% of these states’ adjusted uninsured populations (Exhibit 1), and to 9.4% of these states non-group beneficiaries (many of whom presumably will now have to purchase coverage on the HIE, Exhibit 2)Enrollment rates in states relying on the Federally-facilitated exchange are lower, presumably because the Federal enrollment website tends to be more difficult for beneficiaries to traverse. 1.2M persons enrolled in the Federal-exchange states, equivalent to 3.6% of these states’ uninsured (Exhibit 1), and to 5.9% of these states’ non-group beneficiaries (Exhibit 2)Thus it remains clear that the Federal website’s problems have reduced enrollment levels to date. If enrollment in states relying on the Federal website was on par with enrollment in states managing their own exchanges, overall enrollment would be between 0.7M and 1.2M persons greaterAdverse selection is a key risk to the health of the HIEs, and the question has been raised whether the challenges faced by beneficiaries on the Federal site would amplify these risks. Specifically, the question is whether sicker enrollees are more likely than healthier enrollees to persist in enrolling when the enrollment process is so challengingWe can’t yet see the relative health of the persons enrolling, but we can see their ages. A close cousin of the tough enrollment process / adverse selection hypothesis holds that
 younger / healthier enrollees are less likely to persist through a difficult enrollment process than older / less healthy enrollees. If this were true, then the age mix of enrollees on the state and Federally-facilitated exchanges should be different – specifically the young should be under-represented on the federal exchange as compared to the state exchangesPersons aged less than 35 constitute 32.0% (range 18.0% to 51.0%) of state-exchange enrollees, v. 28.7% (range 21.0% to 44.0%, by state) of federal-exchange enrollees (Exhibit
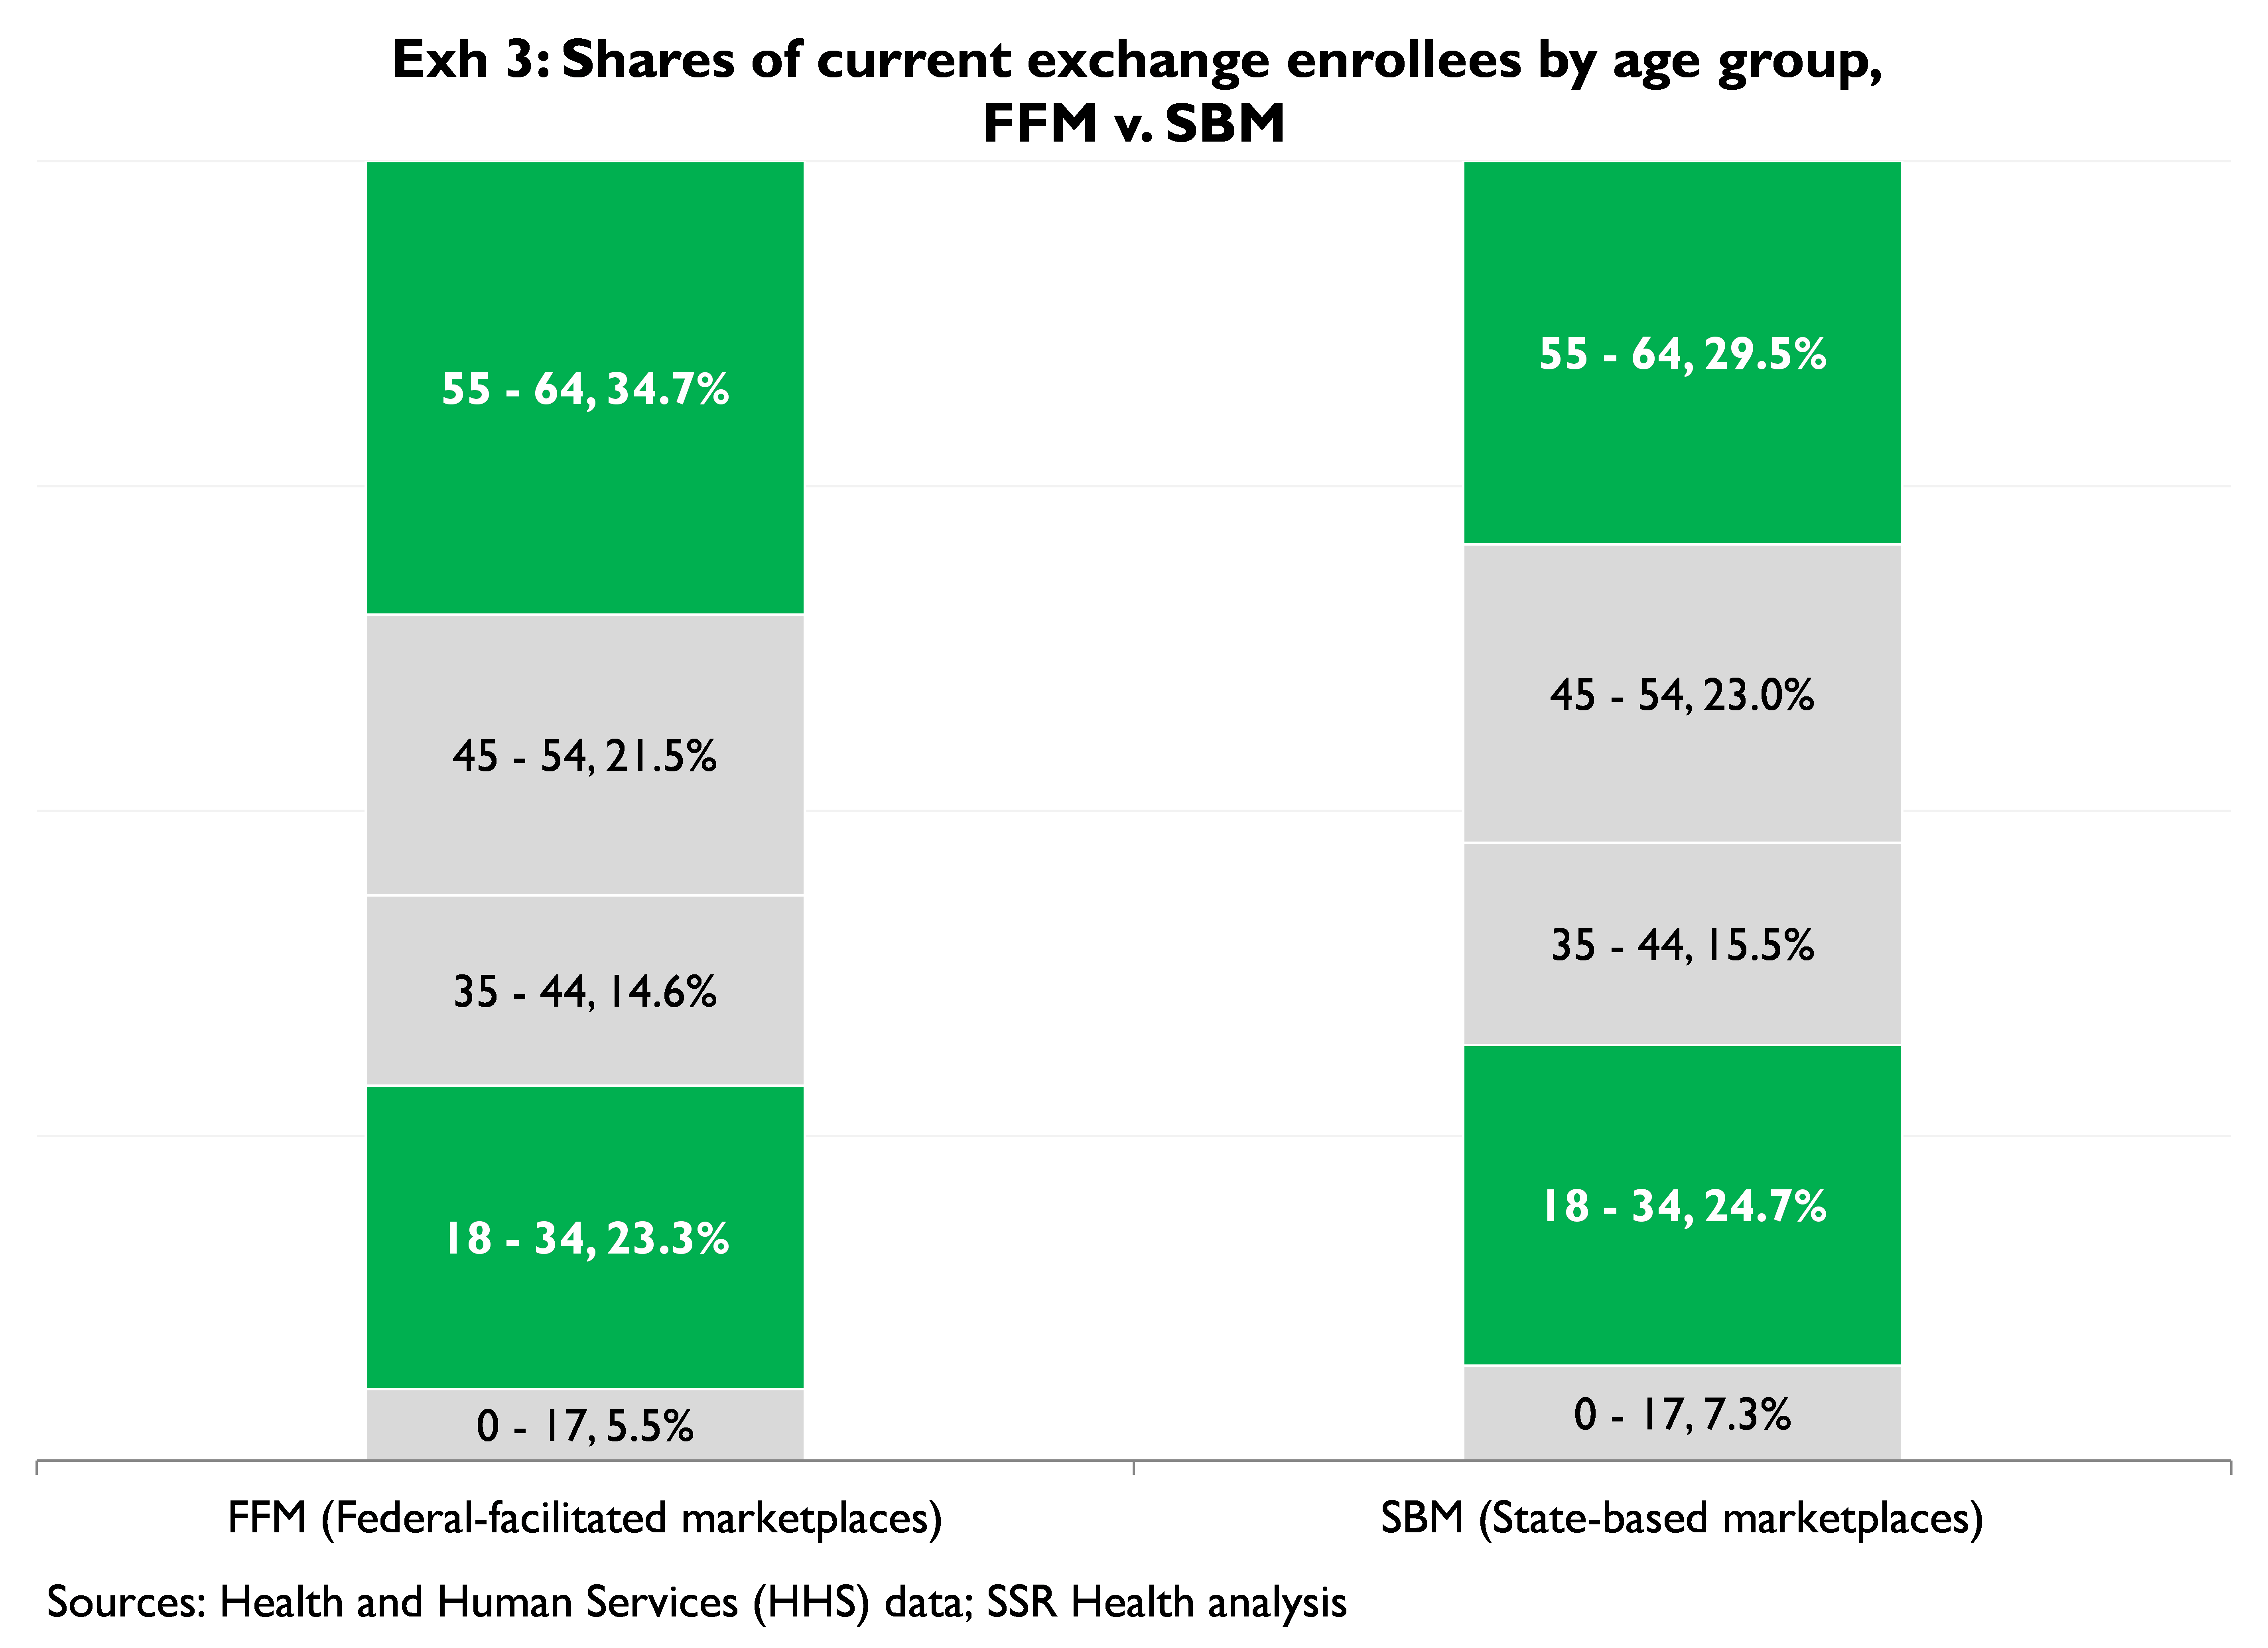
3). So in precise mathematical terms there are fewer young enrollees on the less functional federal exchange, though it’s not clear the difference will persist as the federal exchange improvesAs near as we can tell, it’s not the small (3.3%) difference in 0 – 34 y.o. participation between state and federal exchanges that sets the stage for adverse selection, it’s the large extent to which age-mix is skewed to older beneficiaries across the combined (state + federal) base of enrollees

Last December we offered an analysis[1] of adverse selection risks on the HIEs, and as part of that analysis calculated the 18 – 64 age-mix we believed would have to be met for adverse selection to be avoided.
Exhibit 4 compares what we believe is a ‘balanced’ age-mix that avoids adverse selection (grey columns) to the current age-mix of HIE enrollees (green columns) – plainly the age-mix of the current enrollees skews much older than our estimate of ‘balanced’ age-mix
To be fair, we can’t really know if the current enrollee mix will result in adverse selection without also knowing the relative health status of these enrollees – i.e. estimating adverse selection risks with these limited variables is an incredibly noisy process. That said, we would tend to think that if anything, these early adopters are less healthy than the average potential beneficiary, which of course feeds our expectation of adverse selection
As a final argument that the current skew in age-mix has relatively little to do with problems on the federal exchange, we would  point out that the relative odds of enrolling by age correspond fairly well with what we know about the relative risk aversion of potential enrollees by age (Exhibit 5). A note of caution – the y-axes in Exhibits 4 and 5 are measuring very different things. In Exhibit 4, we’re measuring the percent of total enrollees by age category (i.e. “age-mix”); in Exhibit 5 we’re measuring the percent of potential enrollees in a given age group who actually enroll. Across the nation as a whole, the young are enrolling at substantially lower rates than the old – only 2% of potential enrollees[2] aged 18-25 have enrolled, as compared to more than 7% of potential enrollees aged 55-64 (green columns, Exhibit 5). And, these relative odds of enrolling by age category correspond fairly well to the relative levels of risk aversion[3] shown by each age category. This suggests the odds of enrolling by age group are a function of relative risk aversion, rather than any difference in willingness to confront the difficulties of enrollment
[1] “Why Adverse Selection is Likely on the HIEs”; SSR Health LLC; December 15, 2013
[2] Uninsured less newly eligible Medicaid beneficiaries, plus 2013 non-group beneficiaries
[3] As measured by survey responses in the context of the Medical Expenditure Panel Survey (MEPS)